. 2013 May 9;497(7448):217-23.
doi: 10.1038/nature12122. Epub 2013 May 1.

mTOR kinase structure, mechanism and regulation

Affiliations

mTOR kinase structure, mechanism and regulation

Haijuan Yang et al. Nature. .

Abstract

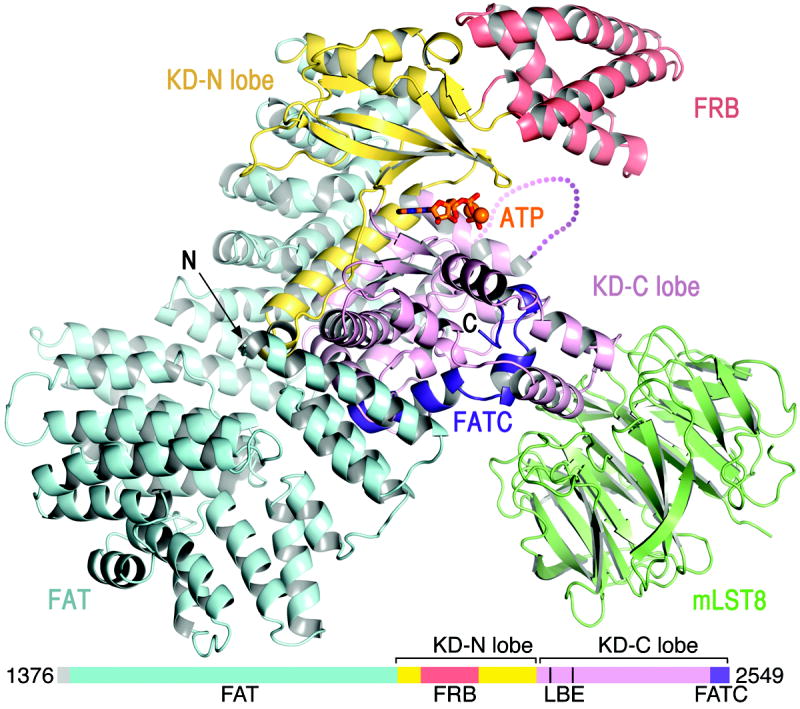
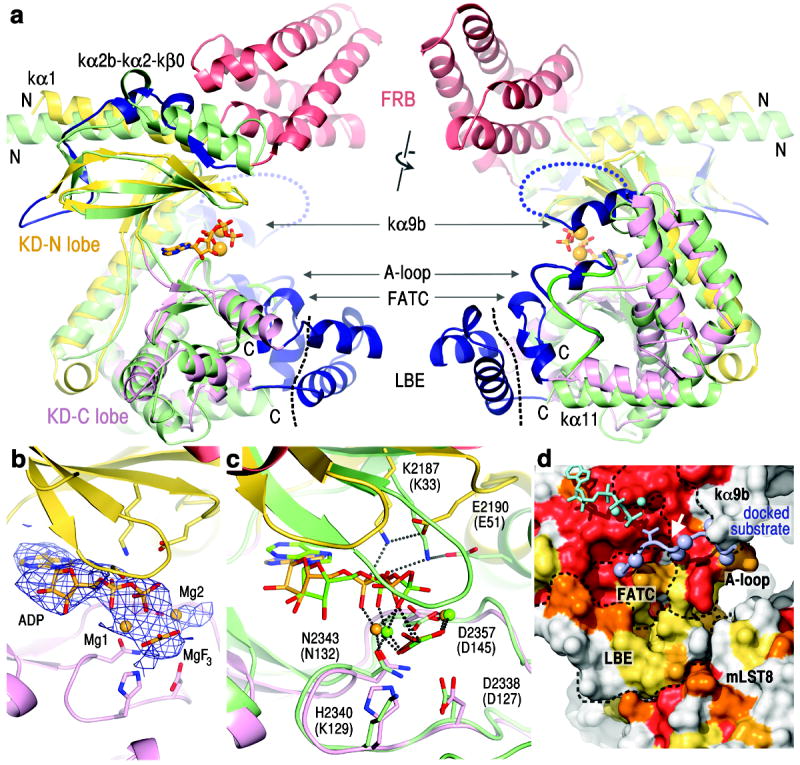
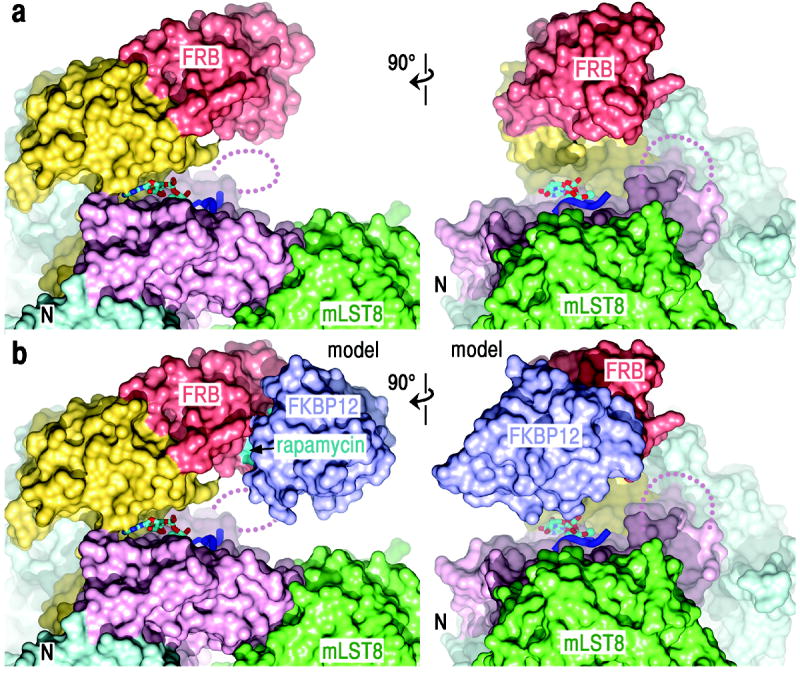
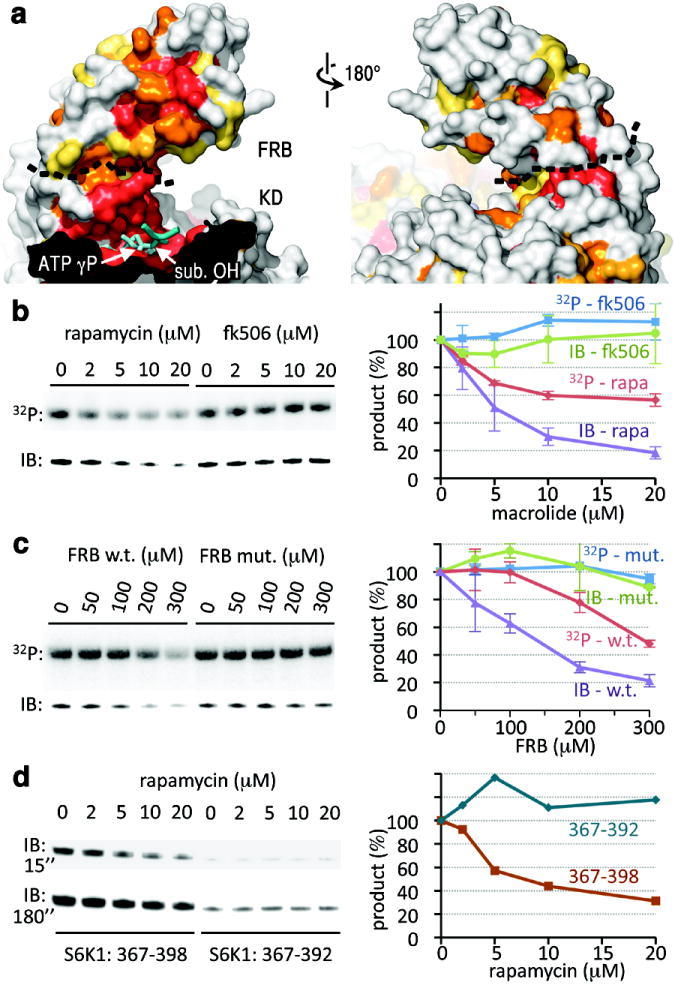
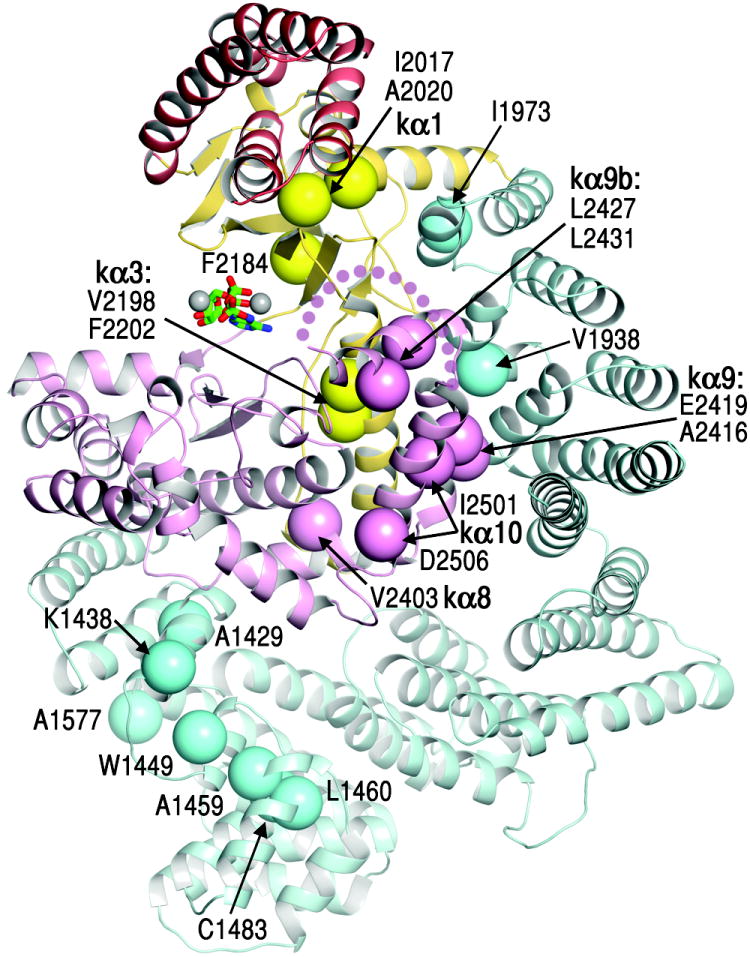
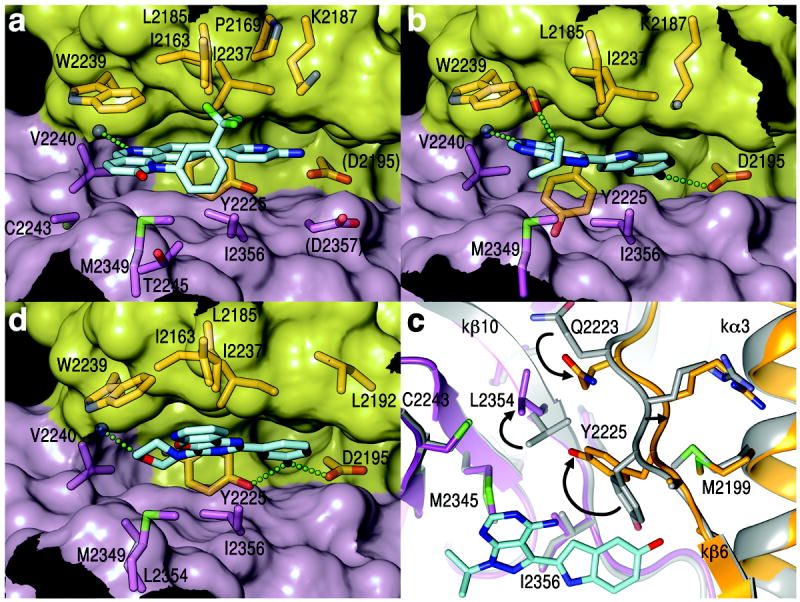
The mammalian target of rapamycin (mTOR), a phosphoinositide 3-kinase-related protein kinase, controls cell growth in response to nutrients and growth factors and is frequently deregulated in cancer. Here we report co-crystal structures of a complex of truncated mTOR and mammalian lethal with SEC13 protein 8 (mLST8) with an ATP transition state mimic and with ATP-site inhibitors. The structures reveal an intrinsically active kinase conformation, with catalytic residues and a catalytic mechanism remarkably similar to canonical protein kinases. The active site is highly recessed owing to the FKBP12-rapamycin-binding (FRB) domain and an inhibitory helix protruding from the catalytic cleft. mTOR-activating mutations map to the structural framework that holds these elements in place, indicating that the kinase is controlled by restricted access. In vitro biochemistry shows that the FRB domain acts as a gatekeeper, with its rapamycin-binding site interacting with substrates to grant them access to the restricted active site. Rapamycin-FKBP12 inhibits the kinase by directly blocking substrate recruitment and by further restricting active-site access. The structures also reveal active-site residues and conformational changes that underlie inhibitor potency and specificity.


Conflict of interest statement

The authors declare no competing financial interests.

Figures

Figure 1
Figure 1. Structure of the mTORΔN-mLST8-ATPγS-Mg complex
mTOR is coloured as indicated in the linear schematic, mLST8 is coloured green, ATP is shown as sticks, and Mg2+ ions as spheres.
Figure 2
Figure 2. mTOR kinase domain and active site conformation
a, Superposition of the kinase domains of mTOR and PIK3C3 (PDB 3IHY; green) in two views rotated by ~180°. Left view is related to that of Figure 1. The FRB is colored red, and the remaining mTOR insertions dark blue. Black dashed line delineates the LBE, and the blue dotted loop indicates the disordered region between kα9b and kα10. b, The 3.5 Å Fo-Fc electron density, contoured at 2.5 σ, of the mTOR TS complex before ADP-MgF3-Mg2 was built. c, Superposition of the mTOR and CDK2 TS (PDB 3QHW) complexes. CDK2 and its nucleotide are coloured green (its residue labels in parentheses). d, Molecular surface representation of the C lobe portion of the mTOR catalytic cleft, coloured according to conservation entropy (red invariant in 22 orthologs, orange in 21, yellow-orange in 20, and yellow in 18-19). Dashed lines delineate the boundaries of structural elements (labelled). The docked substrate peptide is coloured light blue, with its threonine phosphorylation site shown as sticks, the remaining side chains as spheres (Cβ atoms), and its +1 position indicated by a white arrow.
Figure 3
Figure 3. The kinase active site is recessed at the bottom of a deep cleft
a, Surface representation of mTORΔN-mLST8-ADP-MgF3-Mg2 in two orthogonal views. Dark blue ribbon indicates the docked substrate peptide (positions -2 to +2) from Figure 2d. b, Surface representation of the mTORΔN-mLST8-rapamycin-FKBP12 model. Rapamycin (cyan) and FKBP12 (blue) are labelled.
Figure 4
Figure 4. The rapamycin-binding site of the FRB recruits S6K1 into the catalytic cleft
a, Surface representations of the FRB and portion of the catalytic cleft, coloured by sequence conservation as in Figure 2d. ADP-MgF3-Mg2 is in cyan with the TS mimic MgF3 group labelled “ATP γP”. The black dashed line delineates the FRB-KD boundary. The docked substrate peptide from Figure 2d is shown in blue (positions -1 to +1), with its phosphorylation site labelled “sub. OH”. b, Phosphorylation of S6K1ki (10 μM) by mTORΔN-mLST8 (20 nM), measured by P incorporation (top panel) and by immunoblotting with a phosphoThr389-specific antibody (lower panel), in the presence of the indicated concentrations of rapamycin or FK506. The average and standard deviation of three independent repetitions is plotted as a percentage of the 0 μM macrolide reaction of each set. c, Phosphorylation of S6K1ki (10 μM) by mTORΔN-mLST8 (20 nM) in the presence of the indicated concentrations of the wild type or S2035I mutant FRB. Reactions were repeated twice, and results plotted as in (b). d, Phosphorylation of GST-tagged S6K1367-398 (10 μM) and S6K1367-392 (10 μM) by mTORΔN-mLST8 (20 nM) in the presence of the indicated concentrations of rapamycin. Two different exposures (15 and 180 sec.) of the phosphoThr389-specific immunoblot are shown. The quantitation of the 15 sec. immunoblot is plotted on the right.
Figure 5
Figure 5. mTOR activating mutations map to structural elements involved in restricting active site access
Activating mutations- reported for mTOR, yeast Tor2 and Tor1p are shown as large spheres (labelled, with structural elements in bold), coloured as in Figure 1.
Figure 6
Figure 6. Structures of the Torin2, PP242 and PI-103 inhibitors bound to the mTOR catalytic cleft
a Stick representation of Torin2 (C atoms coloured cyan, N blue, O red, F green) and of mTOR residues within 4 Å (except for D2195 and D2357). The mTOR cleft is shown in transparent surface representation, with the N lobe in yellow and C lobe in pink. Green dotted line indicates atoms within hydrogen-bonding distance and geometry. b, PP242-mTOR structure, represented as in (a). c, Conformational change in the inner hydrophobic pocket of mTOR on PP242 (cyan) binding. Arrows indicate side chain rotations and main chain shifts compared to ATPγS-bound mTOR (gray). View looking down the vertical axis of (b). d, PI103-mTOR structure, represented as in (a).

Comment in

References

    1. Zoncu R, Efeyan A, Sabatini DM. mTOR: from growth signal integration to cancer, diabetes and ageing. Nat Rev Mol Cell Biol. 2011;12:21–35. - PMC - PubMed
    1. Shaw RJ, Cantley LC. Ras, PI(3)K and mTOR signalling controls tumour cell growth. Nature. 2006;441:424–430. - PubMed
    1. Keith CT, Schreiber SL. PIK-related kinases: DNA repair, recombination, and cell cycle checkpoints. Science. 1995;270:50–51. - PubMed
    1. Hara K, et al. Raptor, a binding partner of target of rapamycin (TOR), mediates TOR action. Cell. 2002;110:177–189. - PubMed
    1. Kim DH, et al. mTOR interacts with raptor to form a nutrient-sensitive complex that signals to the cell growth machinery. Cell. 2002;110:163–175. - PubMed

Publication types

MeSH terms

Substances