. 2013 Jul;110(2):505-21.
doi: 10.1152/jn.01104.2012. Epub 2013 May 1.

Long-term potentiation of synaptic transmission in the adult mouse insular cortex: multielectrode array recordings

Affiliations

Long-term potentiation of synaptic transmission in the adult mouse insular cortex: multielectrode array recordings

Ming-Gang Liu et al. J Neurophysiol. 2013 Jul.

Abstract

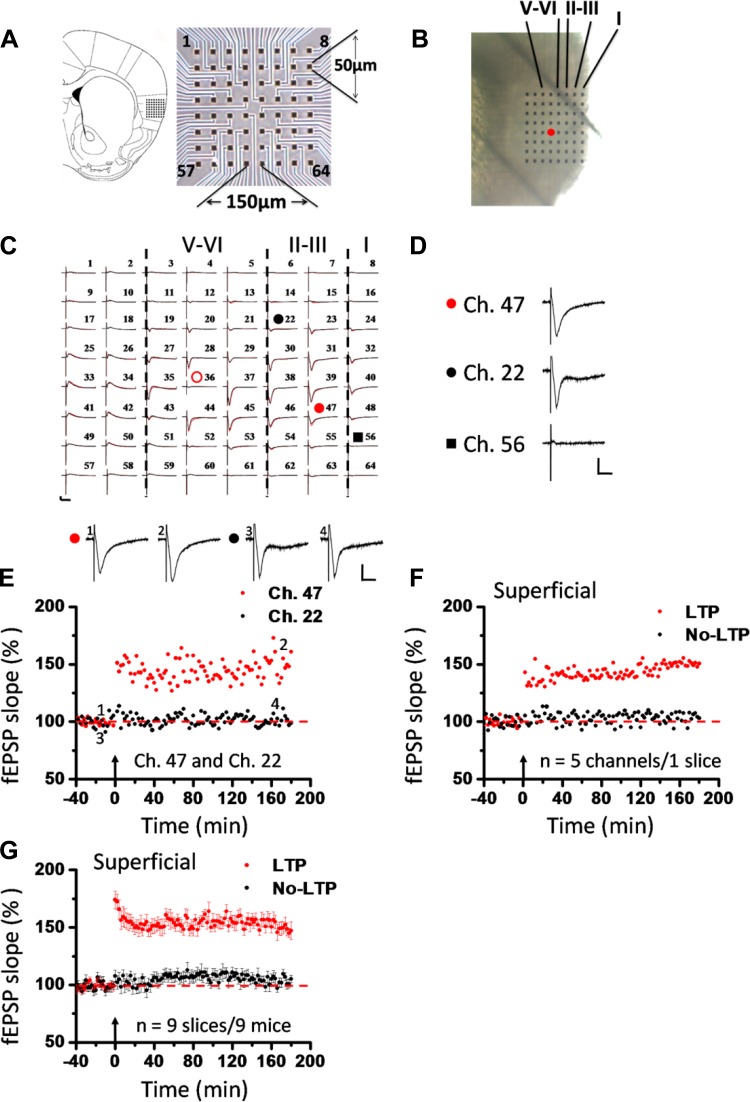
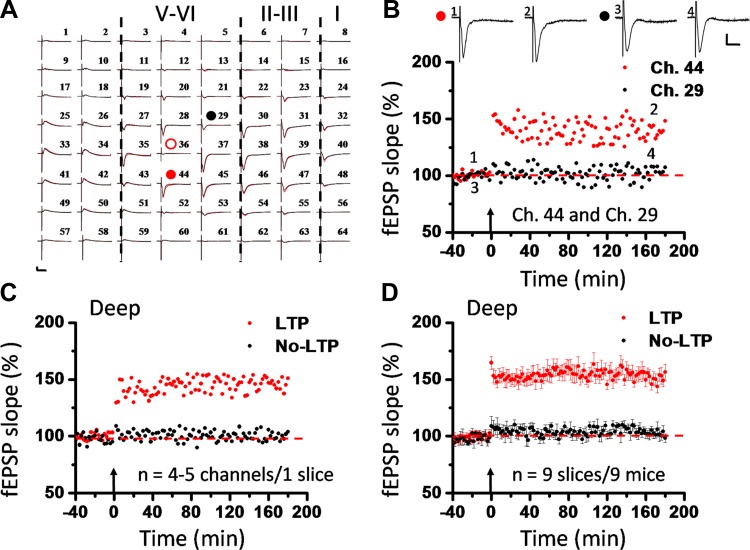
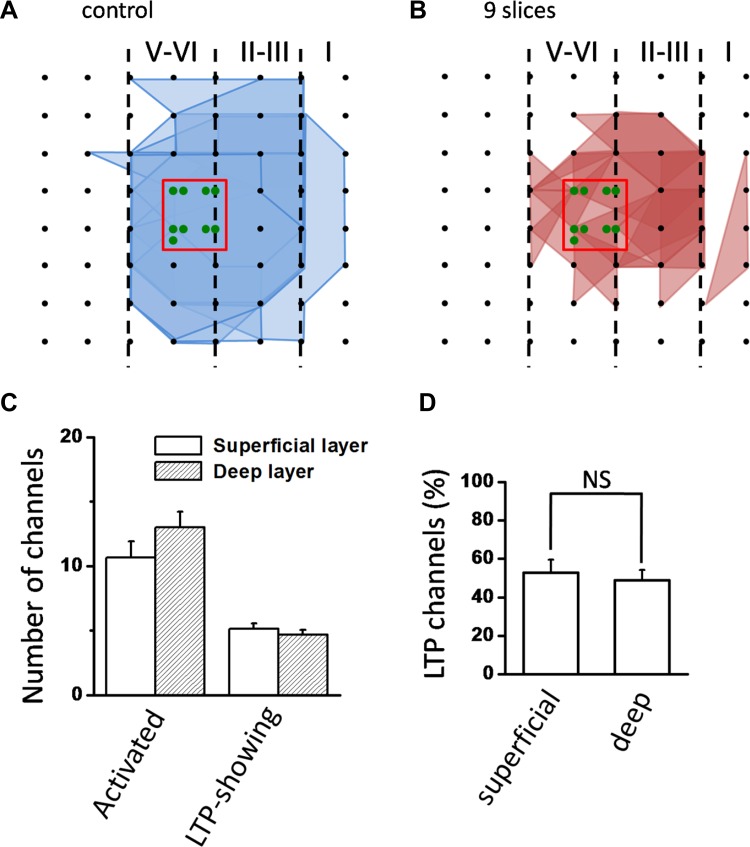
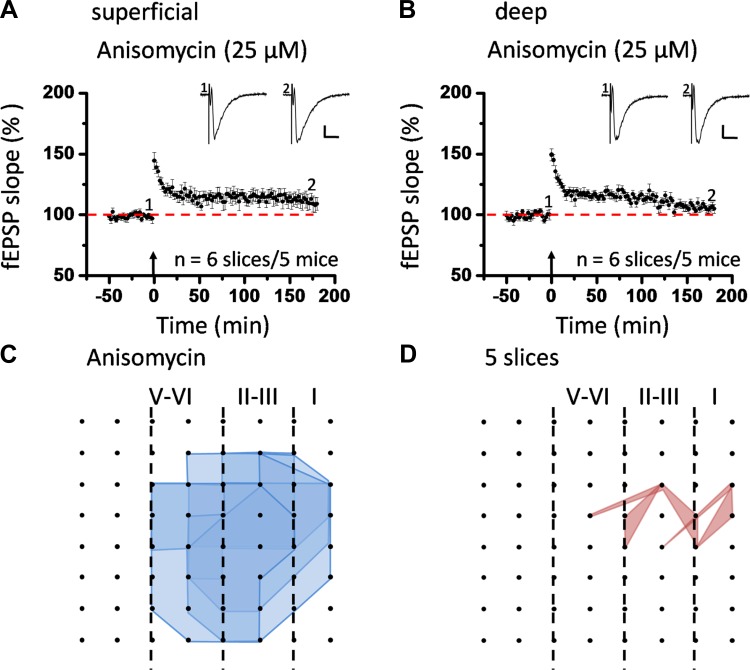
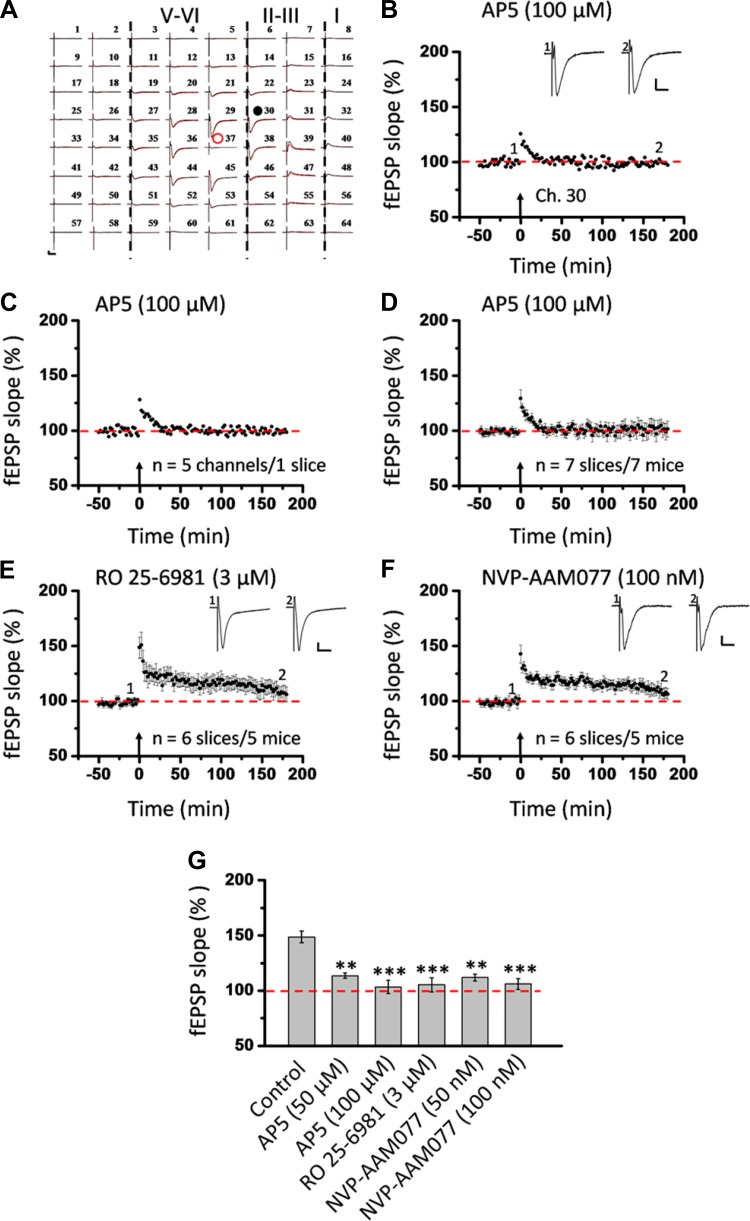
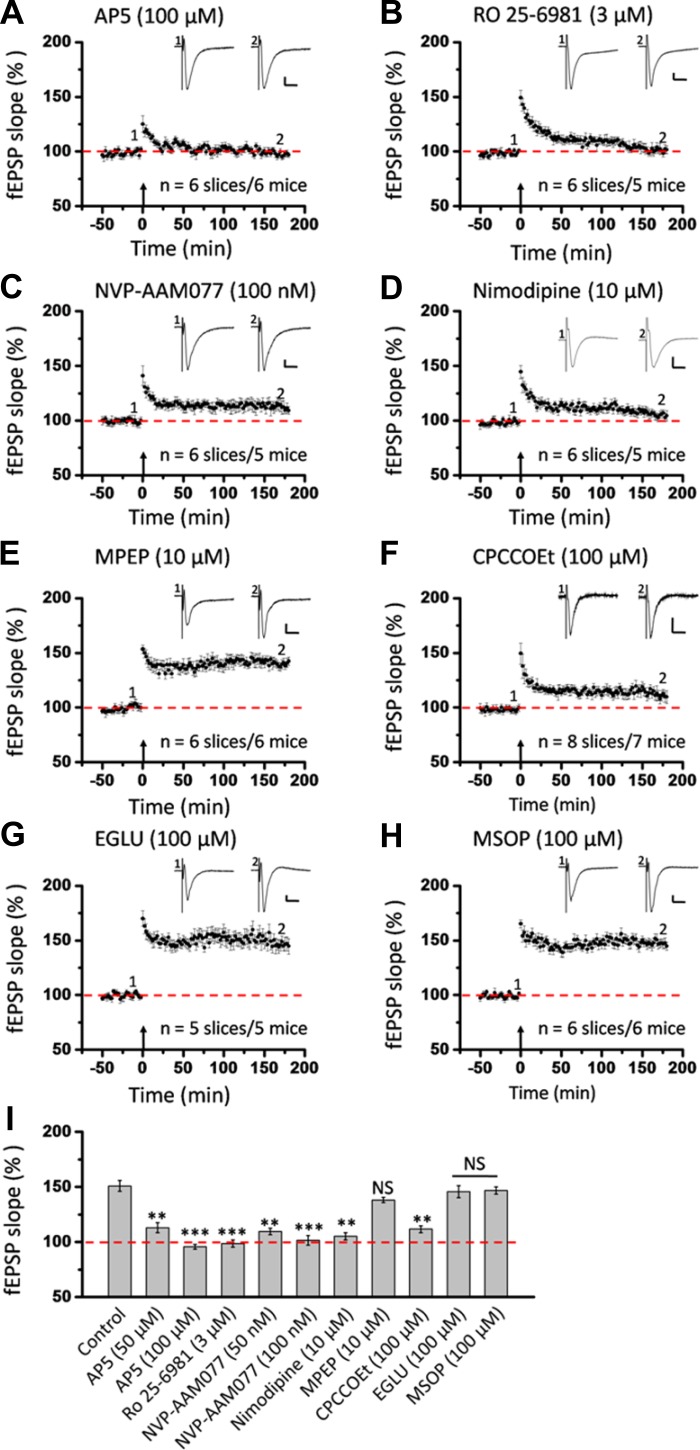
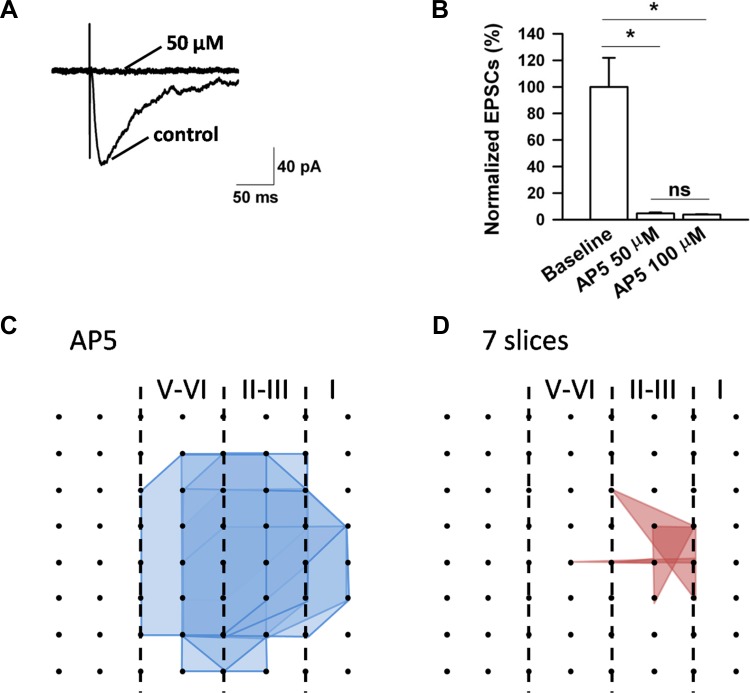
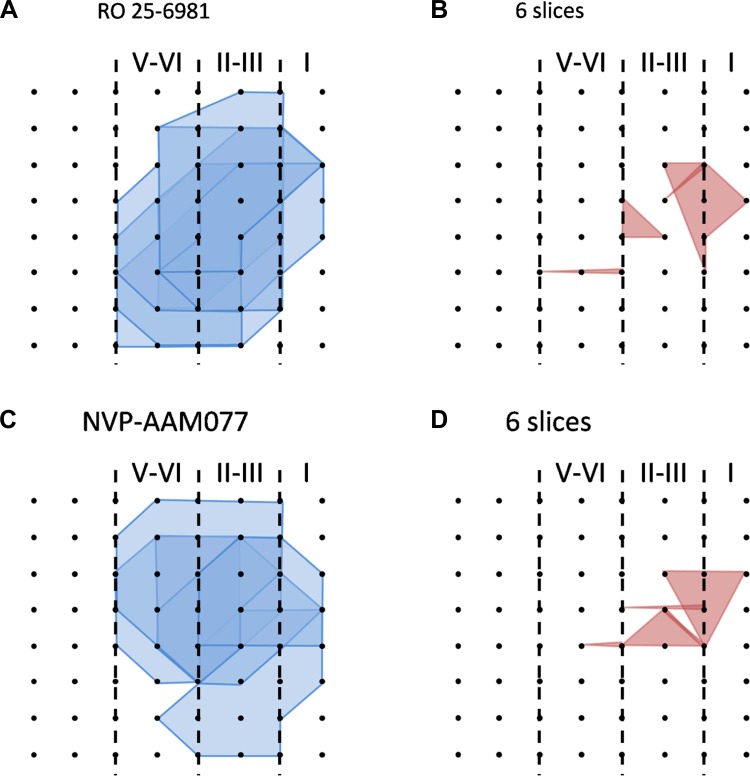
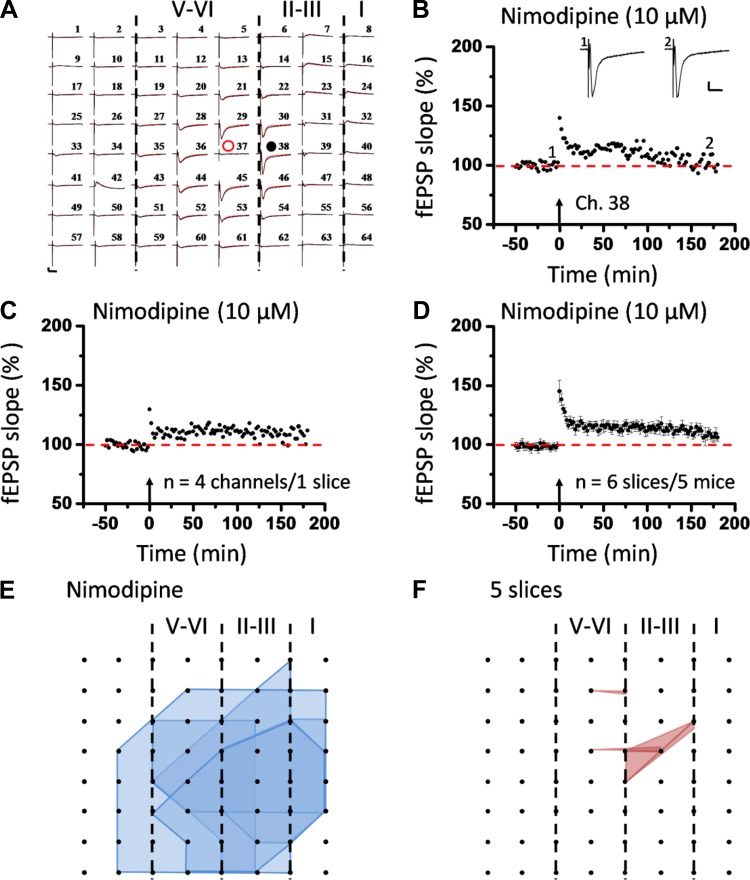
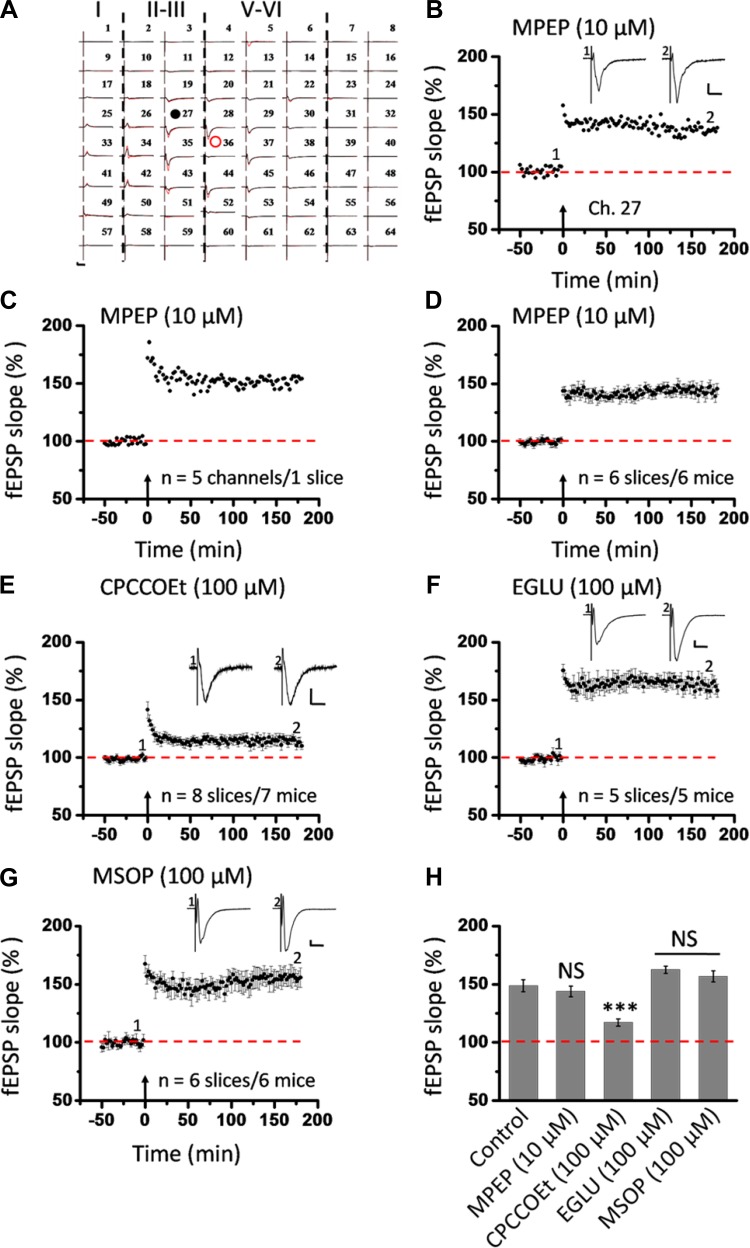
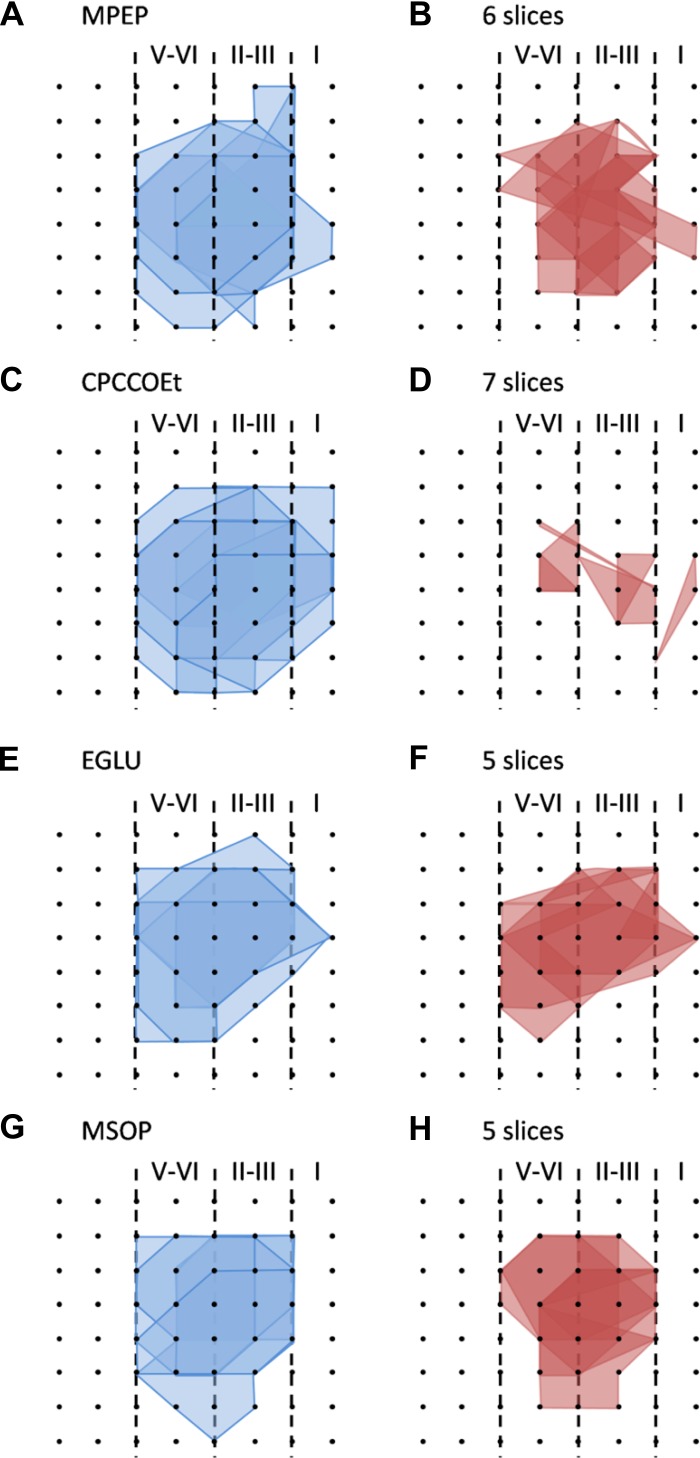
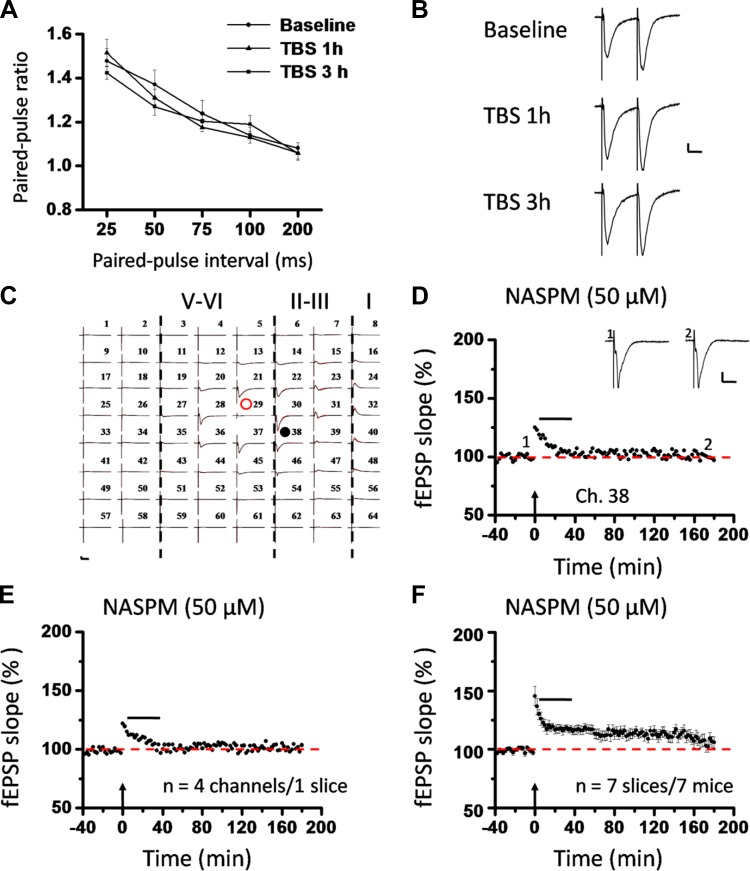
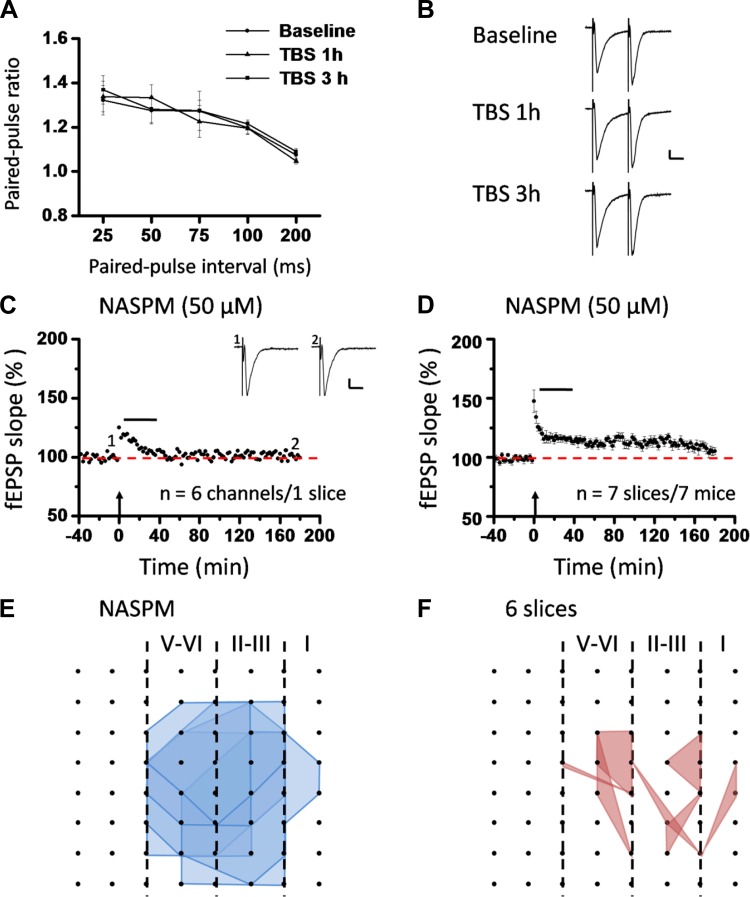
The insular cortex (IC) is widely believed to be an important forebrain structure involved in cognitive and sensory processes such as memory and pain. However, little work has been performed at the cellular level to investigate the synaptic basis of IC-related brain functions. To bridge the gap, the present study was designed to characterize the basic synaptic mechanisms for insular long-term potentiation (LTP). Using a 64-channel recording system, we found that an enduring form of late-phase LTP (L-LTP) could be reliably recorded for at least 3 h in different layers of IC slices after theta burst stimulation. The induction of insular LTP is protein synthesis dependent and requires activation of both GluN2A and GluN2B subunits of the NMDA receptor, L-type voltage-gated calcium channels, and metabotropic glutamate receptor 1. The paired-pulse facilitation ratio was unaffected by insular L-LTP induction, and expression of insular L-LTP required the recruitment of postsynaptic calcium-permeable AMPA receptors. Our results provide the first in vitro report of long-term multichannel recordings of L-LTP in the IC in adult mice and suggest its potential important roles in insula-related memory and chronic pain.

Keywords: calcium-permeable AMPA receptor; glutamate receptor; insular cortex; long-term potentiation; multielectrode array.


Figures

Fig. 1.
Fig. 1.
Induction of late-phase long-term potentiation (L-LTP) in the superficial layer of the insular cortex (IC). A: schematic diagram showing location of 1 MED64 probe on the coronal IC slice (left; adapted from Paxinos and Franklin 2001 with permission) as well as arrangement of the 8 × 8 recording array (interelectrode distance: 150 μm, electrode size: 50 × 50 μm; right). B: light microscopy photograph showing relative location of IC with the MED64 probe and the layer designation. Red dot indicates stimulation site in deep layer (layer V-VI). C: overview of multisite synaptic responses recorded at baseline (black) and 3 h after theta burst stimulation (TBS) (red). Red open circle denotes the stimulated channel (Ch. 36), while red and black filled circles mark the superficial channels undergoing (Ch. 47) and not undergoing (Ch. 22) L-LTP, respectively. Black rectangle represents the channel not exhibiting any response in the baseline state (Ch. 56). Vertical lines demarcate different layers. D: example traces of Ch. 47, Ch. 22, and Ch. 56 from C shown in an enlarged scale for the baseline state. E: results of 1 channel showing L-LTP (Ch. 47) and the other channel not showing L-LTP (Ch. 22) in 1 slice. Inset: representative field excitatory postsynaptic potentials (fEPSPs) at time points indicated by numbers in graph. F: summary of averaged data from 5 superficial channels in each category within the same slice. G: pooled data from 9 slices from 9 mice, separately illustrating the results of LTP-occurring channels and LTP-not occurring channels in the superficial layer. TBS application in the deep layer resulted in an enduring synaptic potentiation that could last for at least 3 h. However, some channels did not undergo LTP in response to the same protocol. Arrows in E–G indicate starting point of TBS application. Calibration in C–E: 100 μV, 10 ms. Error bars in G represent SE.
Fig. 2.
Fig. 2.
Induction of L-LTP in deep layer of the IC. A: overview of spatial distribution of insular L-LTP induction in the deep layer (black lines, baseline; red lines, 3 h after TBS). Red open circle denotes the stimulated channel (Ch. 36), while red and black filled circles mark the deep channels showing (Ch. 44) and not showing (Ch. 29) L-LTP, respectively. Vertical lines demarcate different layers. B: results of 1 channel showing L-LTP (Ch. 44) and the other channel not showing L-LTP (Ch. 29) in 1 slice. Inset: representative fEPSPs at time points indicated by numbers in graph. C: summary of averaged data from 4 or 5 deep channels in each category within the same slice. D: pooled data from 9 slices from 9 mice, separately illustrating the results of LTP-occurring channels and LTP-not occurring channels in the deep layer. Similar results were obtained in the deep layer and in the superficial layer. No layer-related difference was detected in the induction of insular L-LTP. Arrows in B–D indicate starting point of TBS application. Calibration in A and B: 100 μV, 10 ms. Error bars in D represent SE.
Fig. 3.
Fig. 3.
Spatial analysis of insular L-LTP distribution. A and B: polygonal diagrams of the channels that were activated (blue, A) and that showed L-LTP after TBS (red, B) in 9 slices from 9 mice. Black dots represent the 64 channels in the MED64 probe. Vertical lines indicate the layers in the IC slice. Overlapped blue regions denote frequently activated channels, while overlapped red regions indicate channels that show L-LTP. Red boxes in the center of the graphs mark stimulated channels, and number of green circles in the box indicates number of slices that were stimulated in each channel. Since the stimulation sites are usually located in these channels, they are not shown for other polygonal graphs. C: counts of the averaged number of channels that are activated and that undergo L-LTP in both superficial and deep layers. D: bar histogram of grouped data (n = 9 slices/9 mice) showing % of LTP-occurring channels in superficial and deep layers of the IC. There was no layer-related difference in the induction ratio of insular L-LTP. Error bars in C and D represent SE. NS, no significance.
Fig. 4.
Fig. 4.
Induction of insular L-LTP is dependent on new protein synthesis. A: grouped data from 6 slices from 5 mice for anisomycin (25 μM), showing a complete blockade of insular L-LTP in the superficial layer. B: summarized data in the deep layer (n = 6 slices/5 mice). Insets in A and B: representative fEPSPs at time points indicated by numbers in graph. Arrows indicate starting point of TBS application. Calibration: 100 μV, 10 ms. Error bars represent SE. C and D: spatial analysis of effect of anisomycin on LTP distribution in the IC. Shown are polygonal diagrams of the channels that were activated (blue, C) and that showed L-LTP after TBS (red, D) in the presence of anisomycin (n = 5 slices/4 mice). Anisomycin resulted in a great decrease in the number of LTP-occurring channels. LTP maps in this and subsequent figures are labeled as in Fig. 3.
Fig. 5.
Fig. 5.
Activation of both GluN2A and GluN2B subunits is required for L-LTP induction in the superficial layer of the IC. A: 1 sample of 64-channel recordings of insular L-LTP in the presence of d-(−)-2-amino-5-phosphonopentanoic acid (AP5, 100 μM). Black lines, baseline; red lines, 3 h after TBS. Red open circle denotes stimulated channel (Ch. 37), while black filled circle marks superficial channel not undergoing L-LTP (Ch. 30). Vertical lines demarcate different layers. B: results of 1 channel (Ch. 30) showing the failure of L-LTP induction in the presence of AP5. C: summary of averaged data from 5 channels in the superficial layer of the same slice. D: pooled data from 7 slices from 7 mice. E: pooled data (n = 6 slices/5 mice) of the effect of R-(R*,S*)-α-(4-hydroxyphenyl)-β-methyl-4-(phenylmethyl)-1-piperidine propanol (Ro 25-6981, 3 μM) on insular L-LTP induction in the superficial layer. F: pooled data (n = 6 slices/5 mice) for [(R)-[(S)-1-(4-bromophenyl)-ethylamino]-(2,3-dioxo-1,2,3,4-tetrahydroquinoxalin-5-yl)-methyl]-phosphonic acid (NVP-AAM077, 100 nM). G: bar histogram summarizing quantified data within last 10 min of the 3-h recording (170 min to 180 min after TBS). Bath infusion of all drugs could substantially block the induction of insular L-LTP. Administration of a lower dose of AP5 (50 μM, n = 5 slices/4 mice) or NVP-AAM077 (50 nM, n = 5 slices/4 mice) produced less but significant inhibition. Insets in B, E, and F: representative fEPSPs at time points indicated by numbers in graph. Arrows in B–F indicate starting point of TBS application. Calibration in A, B, E, and F: 100 μV, 10 ms. Error bars in D–G represent SE. **P < 0.01, ***P < 0.001.
Fig. 6.
Fig. 6.
Summary of effects of all drugs on insular L-LTP induction in the deep layer of the IC. A: pooled data from 6 slices from 6 mice for AP5 (100 μM). B: pooled data from 6 slices from 5 mice for Ro 25-6981 (3 μM). C: summarized data from 6 slices from 5 mice for NVP-AAM077 (100 nM). D: summarized data from 6 slices from 5 mice for nimodipine (10 μM). E: summarized data from 6 slices from 6 mice for 2-methyl-6-(phenylethynyl)-pyridine (MPEP, 10 μM). F: grouped data from 8 slices from 7 mice for 7-(hydroxyimino)cyclopropa[b]chromen-1a-carboxylate ethyl ester (CPCCOEt, 100 μM). G: grouped data from 5 slices from 5 mice for (2S)-α-ethylglutamic acid (EGLU, 100 μM). H: pooled data from 6 slices from 6 mice for (RS)-α-methylserine-O-phosphate (MSOP, 100 μM). I: bar histogram summarizing quantified data within last 10 min of the 3-h recording (170 min to 180 min after TBS). Similar results were obtained for each drug in the deep layer as in the superficial layer. Insets in A–H: representative fEPSPs at time points indicated by numbers in graph. Arrows in A–H indicate starting point of TBS application. Calibration in A–E, G–H: 100 μV, 10 ms; calibration in F: 50 μV, 10 ms. Error bars in A–I represent SE. **P < 0.01, ***P < 0.001; NS, no significance.
Fig. 7.
Fig. 7.
Effects of AP5 on NMDA receptor-mediated excitatory postsynaptic currents (EPSCs) and spatial analysis of insular L-LTP blockade by AP5. A: representative traces showing that AP5 at 50 μM completely blocked the NMDA receptor-mediated currents. Calibration: 40 pA, 50 ms. B: summarized data of normalized NMDA current amplitude in 3 different states. Asterisks indicate significant difference from baseline, while ns denotes no significant difference between the 2 doses (50 μM: n = 7 neurons/3 mice; 100 μM, n = 3 neurons/2 mice). Error bars represent SE. C and D: polygonal diagrams of channels that were activated (blue, C) and that showed L-LTP after TBS (red, D) in the presence of AP5 (100 μM, n = 7 slices/7 mice). It is evident that the spatial distribution of LTP-occurring channels was greatly diminished when IC slices were pretreated with AP5.
Fig. 8.
Fig. 8.
Spatial analysis of insular L-LTP blockade by Ro 25-6981 and NVP-AAM077. A and B: polygonal graphs of activated (blue, A) and LTP-occurring (red, B) channels among the insular network when TBS is applied in the presence of Ro 25-6981 (3 μM, n = 6 slices/5 mice). C and D: corresponding results for NVP-AAM077 (100 nM, n = 6 slices/5 mice). Both drugs reduced the number of L-LTP-occurring channels compared with the activation map.
Fig. 9.
Fig. 9.
Induction of insular L-LTP in the superficial layer partially depends on L-type voltage-gated calcium channels. A: 1 sample of 64-channel recordings of insular L-LTP in the presence of nimodipine (10 μM). Black lines, baseline; red lines, 3 h after TBS. Red open circle denotes the stimulated channel (Ch. 37), while black filled circle marks the superficial channel not undergoing L-LTP (Ch. 38). Vertical lines demarcate different layers. B: results of 1 channel (Ch. 38) showing suppression of L-LTP induction by nimodipine. Sample fEPSP recordings taken at times indicated by corresponding numbers are shown above plot. C: summary of averaged data from 4 superficial channels of 1 slice. D: pooled data from 6 slices from 5 mice. Bath infusion of nimodipine resulted in a partial but significant inhibition of insular L-LTP induction. Arrows in B–D indicate starting point of TBS application. Calibration in A and B: 100 μV, 10 ms. Error bars in D represent SE. E and F: spatial analysis of nimodipine-induced L-LTP blockade. Shown are the polygonal graphs of activated (blue, E) and LTP-occurring (red, F) channels among the insular network when TBS is applied in the presence of nimodipine (n = 5 slices/4 mice). Nimodipine treatment resulted in a spatially compressed LTP distribution map in the IC.
Fig. 10.
Fig. 10.
Selective involvement of metabotropic glutamate receptor (mGluR)1 in L-LTP induction in the superficial layer of the IC. A: 1 sample of 64-channel recordings of insular L-LTP in the presence of MPEP (10 μM). Black lines, baseline; red lines, 3 h after TBS. Red open circle denotes the stimulated channel (Ch. 36), while black filled circle marks the superficial channel showing L-LTP (Ch. 27). Vertical lines demarcate different layers. B: results of 1 channel (Ch. 27) showing normal induction of insular L-LTP in the presence of MPEP. C: summary of averaged data from 5 superficial channels of 1 slice. D: pooled data from 6 slices from 6 mice. E: pooled data (n = 8 slices/7 mice) for the effect of CPCCOEt (100 μM) on insular L-LTP induction in the superficial layer. F: summarized data (n = 5 slices/5 mice) for EGLU (100 μM). G: grouped data (n = 6 slices/6 mice) for MSOP (100 μM). H: bar histogram summarizing quantified data within last 10 min of the 3-h recording (170 min to 180 min after TBS). Application of antagonists for mGluR5 and group II and group III mGluRs had no effect on the induction of insular L-LTP. However, antagonism of mGluR1 activation resulted in a significant blockade of insular L-LTP. Insets in B and E–G: representative fEPSPs at time points indicated by numbers in graph. Arrows in B–G indicate starting point of TBS application. Calibration in A, B, F, G: 100 μV, 10 ms; calibration in E: 50 μV, 10 ms. Error bars in D–H represent SE. ***P < 0.001; NS, no significance.
Fig. 11.
Fig. 11.
Spatial analysis of the effects of mGluR antagonists on LTP distribution maps in the IC. A and B: polygonal graphs of activated (blue, A) and LTP-occurring channels (red, B) among the insular network when TBS is applied in the presence of MPEP (10 μM, n = 6 slices/6 mice). C and D: corresponding results for CPCCOEt (100 μM, n = 7 slices/6 mice). E and F: data for EGLU (100 μM, n = 5 slices/5 mice). G and H: findings with MSOP (100 μM, n = 5 slices/5 mice). Among the 4 drugs tested, only CPCCOEt produced a significant shrinkage in the insular L-LTP map compared with the activation map.
Fig. 12.
Fig. 12.
Roles of calcium-permeable AMPA receptors (CP-AMPARs) in postsynaptic expression of L-LTP in the superficial layer of the IC. A: paired-pulse ratios (slope of fEPSP2/slope of fEPSP1) recorded with intervals of 25, 50, 75, 100, and 200 ms in superficial layer of the IC. Comparison of the paired-pulse ratio revealed no significant difference under 3 conditions (baseline, TBS 1 h, and TBS 3 h), suggesting a postsynaptic locus of insular L-LTP expression. B: representative traces of paired-pulse facilitation (PPF) with an interval of 25 ms recorded in superficial layer of the IC. C: 1 example of 64-channel recordings of insular L-LTP with the CP-AMPAR blocker 1-naphthylacetyl spermine (NASPM, 50 μM) applied from 5 min after TBS until 35 min after TBS. Black lines, baseline; red lines, 3 h after TBS. Red open circle denotes the stimulated channel (Ch. 29), while black filled circle marks the superficial channel showing the L-LTP blockade by NASPM (Ch. 38). Vertical lines demarcate different layers. D: results of 1 channel (Ch. 38) showing suppression of insular L-LTP expression by NASPM. Sample fEPSP recordings taken at times indicated by corresponding numbers are shown above plot. E: summary of averaged data from 4 superficial channels of the same slice as C and D. F: pooled data from 7 slices from 7 mice. Horizontal bars in D–F denote period of NASPM application. Arrows in D–F indicate starting point of TBS application. Calibration in B–D: 100 μV, 10 ms. Error bars in A and F represent SE.
Fig. 13.
Fig. 13.
Roles of CP-AMPARs in postsynaptic expression of L-LTP in the deep layer of the IC and spatial analysis of the L-LTP distribution map changes. A: paired-pulse ratios (slope of fEPSP2/slope of fEPSP1) recorded with intervals of 25, 50, 75, 100, and 200 ms in the deep layer of the IC. Similar to the superficial layer, the paired-pulse ratio did not differ among the 3 conditions (baseline, TBS 1 h, and TBS 3 h), arguing against a presynaptic locus of insular L-LTP expression. B: raw traces of PPF with an interval of 25 ms recorded in the deep layer of the IC. C: summary of averaged data from 6 deep channels of 1 slice. D: pooled data from 7 slices from 7 mice, demonstrating the inability to express L-LTP in the deep layer of the IC when the synaptic trafficking of CP-AMPARs is blocked by NASPM infusion (50 μM). Horizontal bars in C and D denote period of NASPM application. Arrows in C and D indicate starting point of TBS application. Calibration in B and C: 100 μV, 10 ms. Error bars in A and D represent SE. E and F: spatial analysis of NASPM-induced L-LTP blockade. Shown are polygonal graphs of activated (blue, E) and LTP-occurring (red, F) channels among the insular network when NASPM is applied at 5 min after TBS (n = 6 slices/6 mice). Compared with the baseline state, very few channels showed L-LTP after NASPM application.

Similar articles

Cited by

References

    1. Adaikkan C, Rosenblum K. The role of protein phosphorylation in the gustatory cortex and amygdala during taste learning. Exp Neurobiol 21: 37–51, 2012 - PMC - PubMed
    1. Adesnik H, Nicoll RA. Conservation of glutamate receptor 2-containing AMPA receptors during long-term potentiation. J Neurosci 27: 4598–4602, 2007 - PMC - PubMed
    1. Anwyl R. Metabotropic glutamate receptors: electrophysiological properties and role in plasticity. Brain Res Rev 29: 83–120, 1999 - PubMed
    1. Apkarian AV, Hashmi JA, Baliki MN. Pain and the brain: specificity and plasticity of the brain in clinical chronic pain. Pain 152: S49–S64, 2011 - PMC - PubMed
    1. Asrar S, Zhou Z, Ren W, Jia Z. Ca2+ permeable AMPA receptor induced long-term potentiation requires PI3/MAP kinases but not Ca/CaM-dependent kinase II. PloS One 4: e4339, 2009 - PMC - PubMed

Publication types

LinkOut - more resources