. 2013 Jul;110(2):536-52.
doi: 10.1152/jn.00118.2013. Epub 2013 May 1.

Inhibitory inputs tune the light response properties of dopaminergic amacrine cells in mouse retina

Affiliations

Inhibitory inputs tune the light response properties of dopaminergic amacrine cells in mouse retina

G S Newkirk et al. J Neurophysiol. 2013 Jul.

Abstract

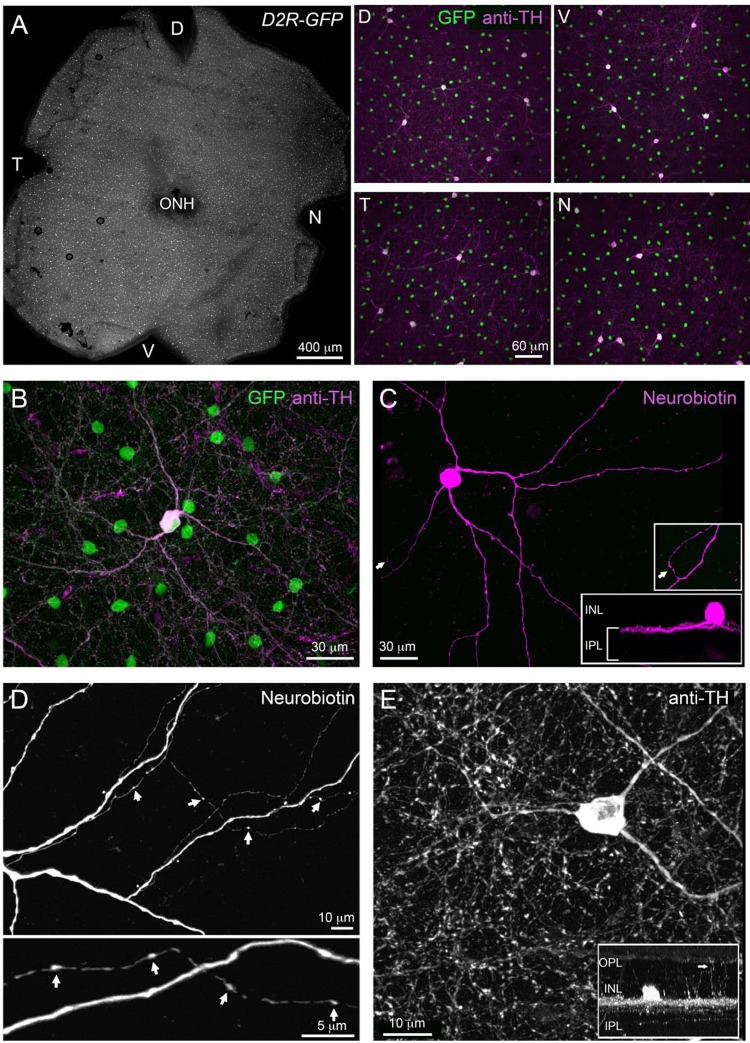
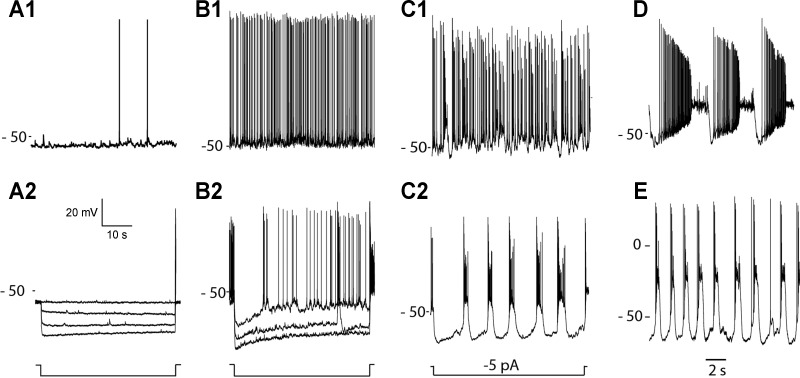
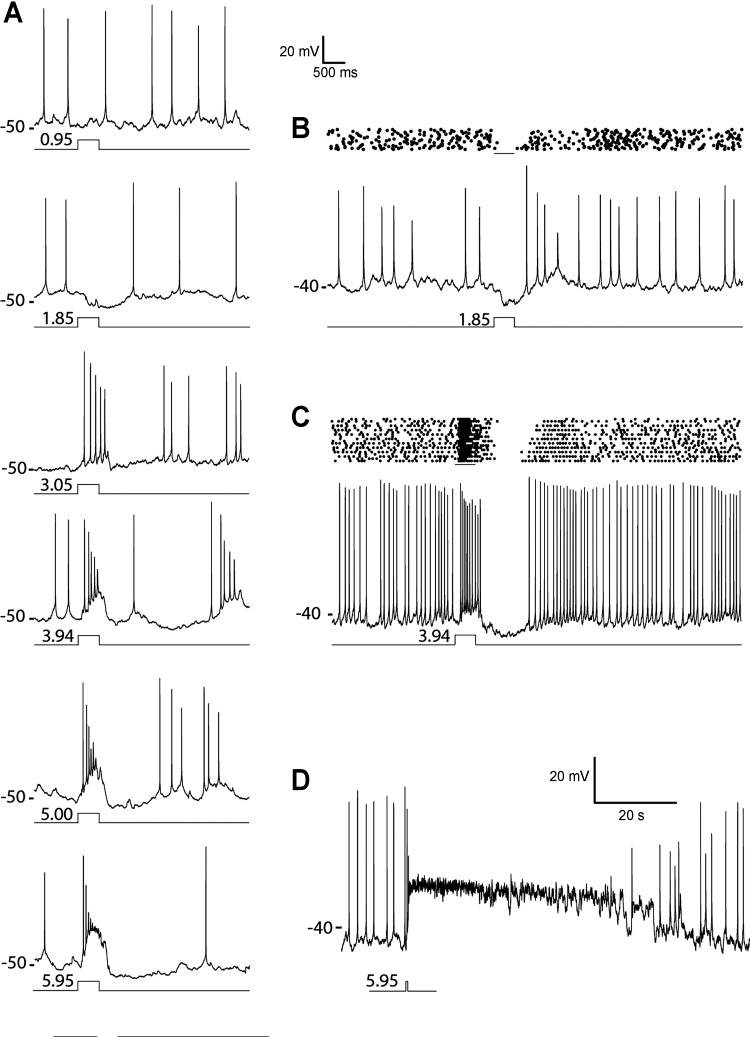
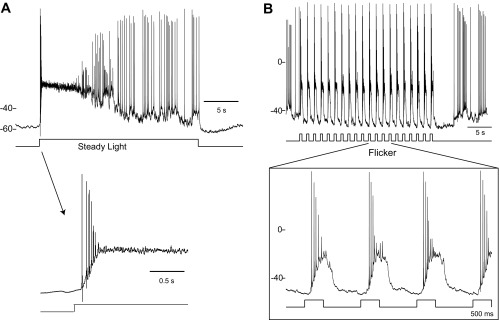
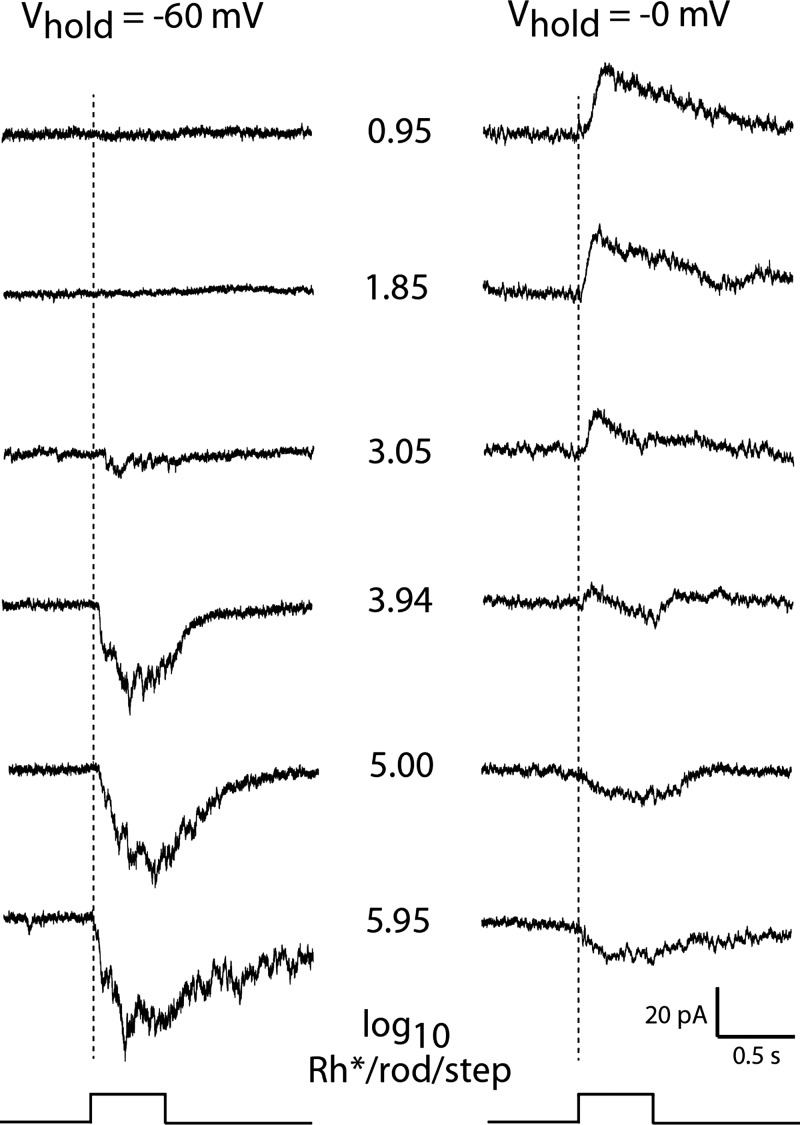
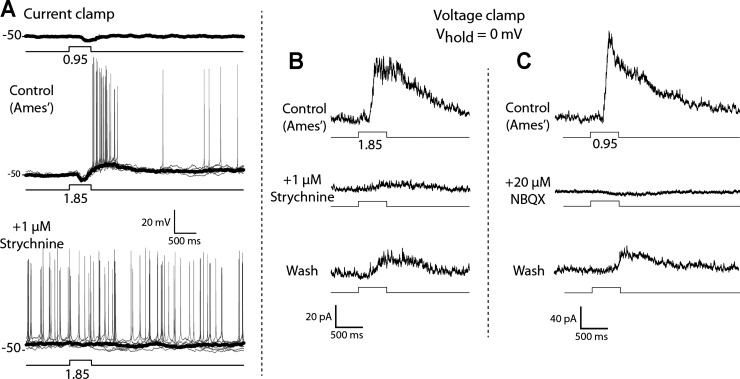
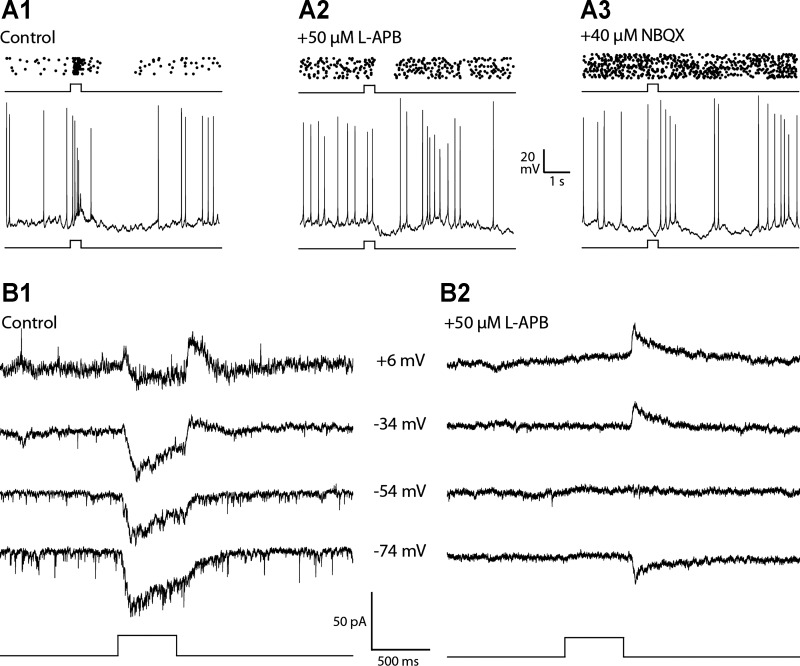
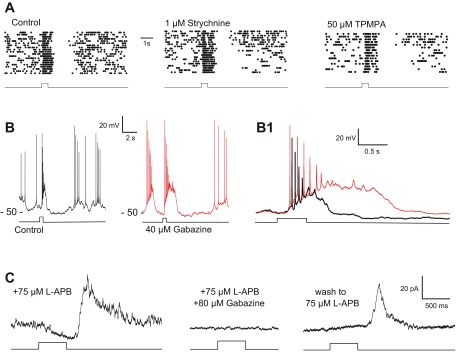
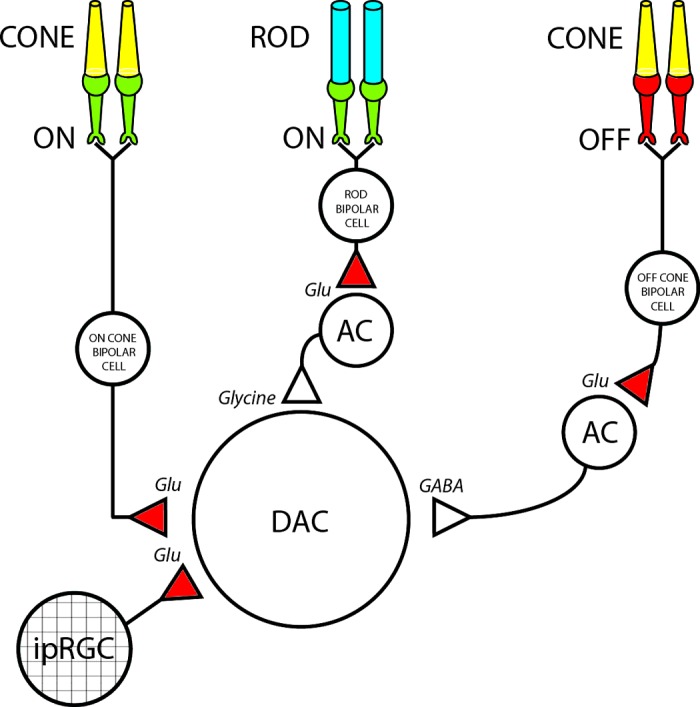
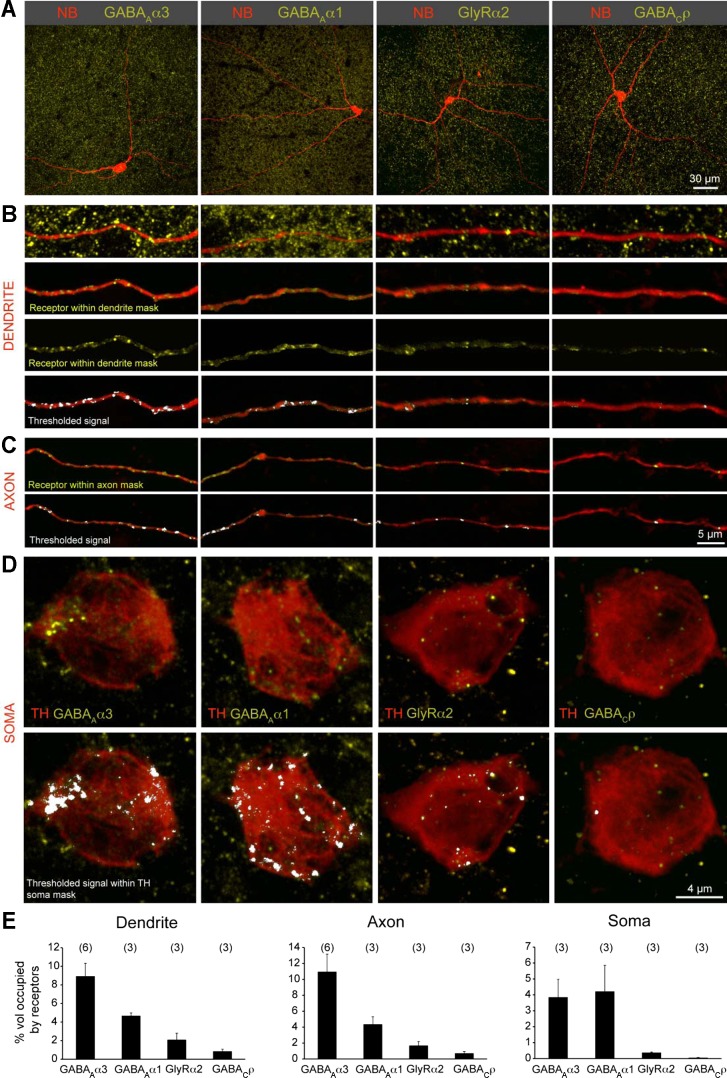
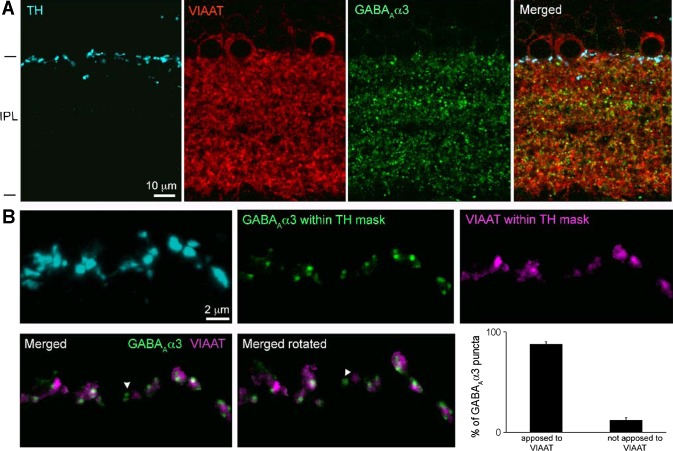
Dopamine (DA) is a neuromodulator that in the retina adjusts the circuitry for visual processing in dim and bright light conditions. It is synthesized and released from retinal interneurons called dopaminergic amacrine cells (DACs), whose basic physiology is not yet been fully characterized. To investigate their cellular and input properties as well as light responses, DACs were targeted for whole cell recording in isolated retina using two-photon fluorescence microscopy in a mouse line where the dopamine receptor 2 promoter drives green fluorescent protein (GFP) expression. Differences in membrane properties gave rise to cell-to-cell variation in the pattern of resting spontaneous spike activity ranging from silent to rhythmic to periodic burst discharge. All recorded DACs were light sensitive and generated responses that varied with intensity. The threshold response to light onset was a hyperpolarizing potential change initiated by rod photoreceptors that was blocked by strychnine, indicating a glycinergic amacrine input onto DACs at light onset. With increasing light intensity, the ON response acquired an excitatory component that grew to dominate the response to the strongest stimuli. Responses to bright light (photopic) stimuli also included an inhibitory OFF response mediated by GABAergic amacrine cells driven by the cone OFF pathway. DACs expressed GABA (GABA(A)α1 and GABA(A)α3) and glycine (α2) receptor clusters on soma, axon, and dendrites consistent with the light response being shaped by dual inhibitory inputs that may serve to tune spike discharge for optimal DA release.

Keywords: amacrine cell; dopaminergic neuron; electrophysiology; immunocytochemistry; retina.


Figures

Fig. 1.
Fig. 1.
Morphology of dopaminergic amacrine cells (DACs) in dopamine receptor 2-green fluorescent protein (Drd2-GFP) transgenic mice. A: distribution of GFP-expressing cells across a Drd2-GFP retina (left) and higher magnification of 4 representative regions immunolabeled for tyrosine hydroxylase (TH) in different parts of the Drd2-GFP retina (right). D, dorsal; V, ventral; T, temporal, N, nasal, ONH, optic nerve head. All GFP-expressing cells with large somata are TH positive. B: higher magnification view showing a large TH-positive, GFP-expressing cell. C: morphology of a large GFP-positive cell as revealed by intracellular filling with neurobiotin. Its cell body lies in the inner nuclear layer (INL), and processes stratify in the outermost part of the inner plexiform layer (IPL; bottom inset). An axonal process is highlighted by an arrow and is shown at higher magnification (top inset). D: a neurobiotin-filled DAC with varicosities along its axonal process (arrows). E: TH immunolabeling in retinal whole-mounts shows a fraction of dopaminergic amacrine processes (arrow in inset) reaching the outer plexiform layer (OPL).
Fig. 2.
Fig. 2.
Cellular properties of DACs. Resting spontaneous spike activities in 4 different cells provide examples of DACs that are nearly silent (A1), continuously active (B1), or exhibit steady discharge with intermixed bursts of spikes (C1) or periodic bursts (D). Resting membrane potentials (in mV) are indicated at left of each trace. The voltage responses evoked by constant current steps in the same cells are shown by traces in A2, B2, and C2, respectively. Negative current steps in A2 and B2 were 20, 30, and 40 pA. Periodic burst firing persists in the presence of a mixture of excitatory and inhibitory synaptic blockers: l-(+)-2-amino-4-phosphonobutyric acid (l-APB; 50 μM), AP5 (50 μM), CNQX (50 μM), picrotoxin (50 μM), and strychnine (1 μM). Labels at left of each recording identify the resting potential (in mV) relative to the voltage trace using the voltage scale provided.
Fig. 3.
Fig. 3.
DAC light response properties. A: DAC light response evoked by 500-ms steps of full-field (700-μm-diameter spot) 440-nm light of indicated intensities (log10 Rh*/rod per step). B and C: spike rasters and example trace showing responses to light steps in different cells. D: an example of DAC that exhibited a prolonged response to a bright full-field step of 440-nm light (9 × 10⁵ Rh*·rod−1·0.5 s−1). Labels at left of each recording indicate the resting potentials (in mV) relative to the voltage trace using the voltage scales provided.
Fig. 4.
Fig. 4.
DAC responses to steady and flickering light. A: 20-s step of light evoked a transient burst of spikes at light onset that gave way to irregular lower frequency spike discharge as the cell adapted to the steady light (n = 4). The termination of action potential discharge at the leading edge of the response by depolarization spike block is shown on an expanded time base in the insert (arrow). B: traces show the entrainment of DAC spike responses to periodic 500-ms stimulus (3.94 log10 Rh*·rod−1·0.5 s−1) that flickers ON and OFF at 0.7 Hz on 2 different time scales. Labels at left of each recording indicate the resting potentials (in mV) relative to the voltage trace using the voltage scales provided.
Fig. 5.
Fig. 5.
Light response intensity series in voltage clamp. Responses evoked by 500-ms steps of full-field 440-nm light at the intensities (middle) expressed as log10 Rh*·rod−1·0.5 s−1 in a representative DAC held at a voltage (Vhold) close to the reversal potential for inhibitory synaptic input (−60 mV; left) and excitatory synaptic input (0 mV; right) in Ames' solution.
Fig. 6.
Fig. 6.
Inhibitory ON response evoked by a dim step of light is blocked by strychnine. A: current-clamp recordings of responses to weak steps of light in the absence and presence of 1 μM strychnine (n = 7). Average response is shown in black, and individual responses are displayed in gray. Labels at left of each recording indicate the resting potentials (in mV) relative to the voltage trace using the voltage scale provided. B: voltage-clamp recordings of outward current response at 0-mV holding potential evoked by dim steps in the absence and presence of 1 μM strychnine. Stimulus intensities are reported as log10 Rh*·rod−1·0.5 s−1 for full-field 440-nm light and are associated with traces showing the timing of the light step.
Fig. 7.
Fig. 7.
Synaptic origin of the excitatory ON response evoked by bright light. Spike raster plots (top) and example single traces (bottom) show the response evoked by a bright step of light in the absence of glutamatergic reagents (A1) and in the presence of l-APB, a metabotropic glutamate receptor agonist that quenches the excitatory light response in ON bipolar cells, alone (A2) and with the addition of 2,3-dihydroxy-6-nitro-7-sulfamoyl-benzo[f]quinoxaline-2,3-dione (NBQX;A3). The results show that the control response had an excitatory ON response that was eliminated by l-APB and an inhibitory OFF response that was blocked by the addition of NBQX (n = 6). B1 and B2 show the currents evoked by bright light in voltage-clamp recordings at the indicated holding potentials (middle) in the absence (control; B1) and presence of l-APB (B2). The ON pathway antagonist eliminated the inward current evoked at light onset but not the outward current at light offset (n = 4). Light stimuli were 500-ms full-field steps of 440-nm light equivalent to 5.0 log10 Rh*·rod−1·0.5 s−1.
Fig. 8.
Fig. 8.
GABAergic inhibitory OFF response evoked by bright light. A: spike rasters showing the persistence of the inhibitory OFF response in the presence of strychnine (n = 4), a glycine receptor antagonist, and (1,2,5,6-tetrahydropyridin-4-yl)methylphosphinic acid hydrate (TPMPA; n = 3), a GABAC receptor antagonist. B: bath application of gabazine (red trace) prolonged the depolarizing response to light, shown on an expanded time base (B1) that compares superimposed responses in the absence (black) and presence (red) of gabazine (n = 9). Labels at left of each recording indicate the resting potentials (in mV) relative to the voltage trace using the voltage scales provided. C: in voltage-clamp recordings (Vhold = 0 mV) in the presence of l-APB there was a slowly increasing negative (inward) current during the light step that was supplanted by a large positive (outward) current at light offset. Both components of the step response were eliminated by gabazine and partially reversed on washout (n = 3). Light stimuli were 500-ms full-field steps of 440-nm light equivalent to 3.94 (A and B) and 5.95 log10 Rh*·rod−1·0.5 s−1 (C).
Fig. 9.
Fig. 9.
DAC synaptic wiring diagram. In the proposed schematic DACs receive excitatory glutamatergic input from ON cone bipolar cells, as well as from intrinsically photosensitive retinal ganglion cells (ipRGCs) in a subset (∼15%) of DACs. In addition, DACs received inhibitory input from 2 sources: one is an unidentified glycinergic amacrine cell (AC) that is driven by excitatory input from rod bipolar cells, and the other is an unidentified GABAergic AC that is driven by excitatory input from OFF cone bipolar cells. Red and green terminals represent ionotropic (AMPA/kainate) and metabotropic (mGluR) glutamatergic synapses, respectively.
Fig. 10.
Fig. 10.
Inhibitory receptor density on DACs. A: neurobiotin fills (NB) of DACs in the Drd2-GFP line colabeled for specific inhibitory receptor subsets: GABAA receptors (α3- or α1-subunit), glycine receptor (α2-subunit), and GABAC receptors (ρ-subunit). B: higher magnification of a stretch of dendrite and receptor labeling. Receptors localized within the volume of the dendrite are visualized by first creating a 3-dimensional (3-D) “dendrite mask” of the NB signal and then digitally excluding signal of the receptor immunolabeling outside this mask. A threshold is imposed above which receptor signal intensities are quantified. C: receptor labeling within the axon mask. D: receptor labeling within the soma mask. Somata were labeled by anti-TH. E: quantification of the percentage of volume of the dendrite, axon, or soma occupied by receptors containing different subunits.
Fig. 11.
Fig. 11.
GABA receptor puncta on TH-immunopositive processes are apposed to inhibitory presynaptic terminals. A: dopaminergic amacrine processes labeled with TH in retinal slices, together with labeling for GABAAα3 receptors and the inhibitory presynaptic marker vesicular inhibitory amino acid transporter (VIAAT) in IPL. Maximum intensity projection of confocal image stack represents 0.9-μm thicknesses. B: to quantify GABAAα3-VIAAT appositions, TH-labeled processes were masked in thicker image stacks (4.8 μm). GABAAα3 and VIAAT signal within the masks were isolated to reveal appositions in 3-D. The majority of GABAAα3 receptor puncta were apposed to VIAAT (exception: arrowhead in merged images). Plots show quantification of the appositions identified by 3-D rotation of the merged images.

Similar articles

Cited by

References

    1. Alonso A, Llinas RR. Subthreshold Na+-dependent theta-like rhythmicity in stellate cells of entorhinal cortex layer II. Nature 342: 175–177, 1989 - PubMed
    1. Armstrong CM, Gilly WF. Access resistance and space clamp problems associated with whole-cell patch clamping. Methods Enzymol 207: 100–122, 1992 - PubMed
    1. Baylor DA, Hodgkin AL. Detection and resolution of visual stimuli by turtle photoreceptors. J Physiol 234: 163–198, 1973 - PMC - PubMed
    1. Bloomfield SA, Dacheux RF. Rod vision: pathways and processing in the mammalian retina. Prog Retin Eye Res 20: 351–384, 2001 - PubMed
    1. Bunney BS, Grace AA. Acute and chronic haloperidol treatment: comparison of effects on nigral dopaminergic cell activity. Life Sci 23: 1715–1727, 1978 - PubMed

Publication types

LinkOut - more resources