

Analysis of maternal and fetal cardiovascular systems during hyperglycemic pregnancy in the nonobese diabetic mouse
- PMID: 23636813
- PMCID: PMC3699463
- DOI: 10.1095/biolreprod.112.105759
Analysis of maternal and fetal cardiovascular systems during hyperglycemic pregnancy in the nonobese diabetic mouse
Abstract
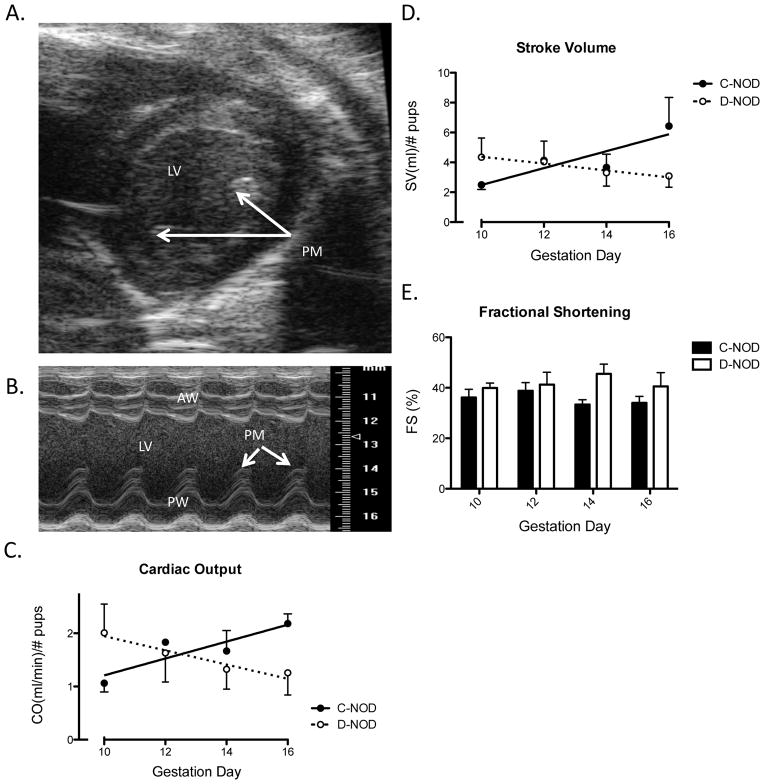
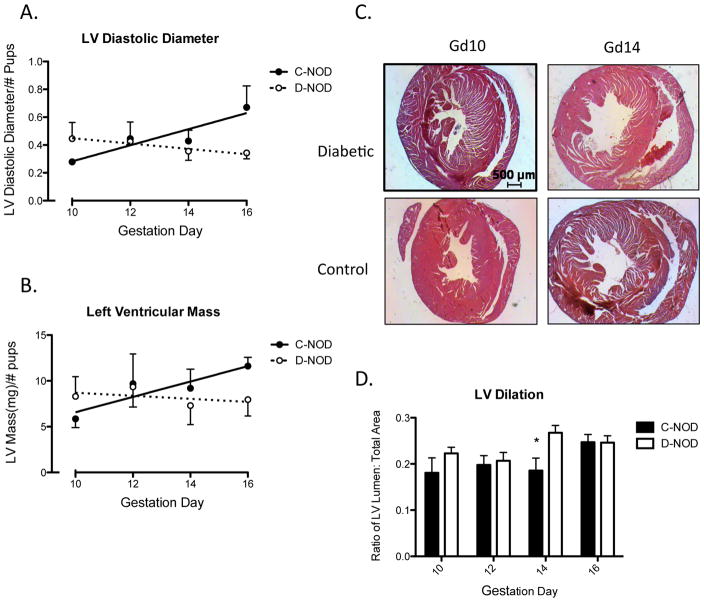
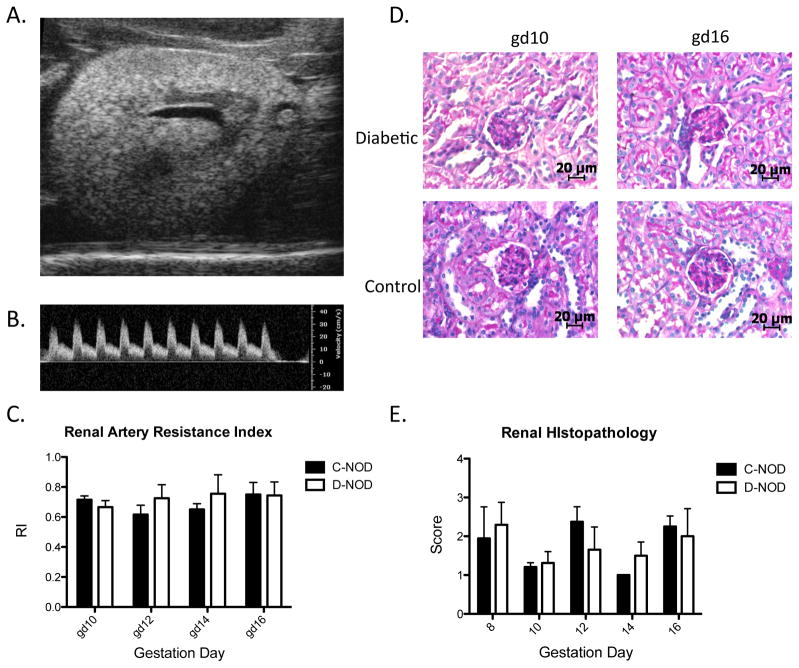
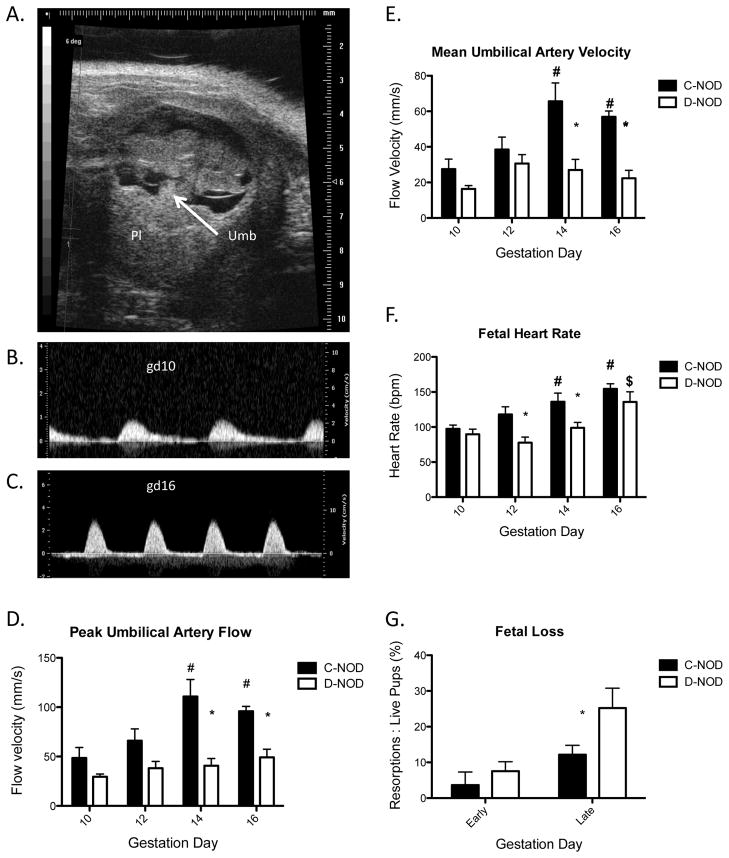
Preconception or gestationally induced diabetes increases morbidities and elevates long-term cardiovascular disease risks in women and their children. Spontaneously hyperglycemic (d)-NOD/ShiLtJ female mice, a type 1 diabetes model, develop bradycardia and hypotension after midpregnancy compared with normoglycemic, age- and gestational day (GD)-matched control (c-NOD) females. We hypothesized that onset of the placental circulation at GD 9-10 and rapid fetal growth from GD 14 correlate with aberrant hemodynamic outcomes in d-NOD females. To develop further gestational time-course correlations between maternal cardiac and renal parameters, high-frequency ultrasonography was applied to d- and c-NOD mice (virgin and at GD 8-16). Cardiac output and left ventricular (LV) mass increased in c-NOD but not in d-NOD mice. Ultrasound and postmortem histopathology showed overall greater LV dilation in d-NOD than in c-NOD mice at mid to late gestation. These changes suggest blunted remodeling and altered functional adaptation of d-NOD hearts. Umbilical cord ultrasounds revealed lower fetal heart rates from GD 12 and lower umbilical flow velocities at GD 14 and GD 16 in d-NOD versus c-NOD pregnancies. From GD 14 to GD 16, d-NOD fetal losses exceeded c-NOD fetal losses. Similar aberrant responses in pregnancies of women with diabetes may elevate postpartum maternal and child cardiovascular risk, particularly if mothers lack adequate prenatal care or have poor glycemic control during gestation.
Keywords: NOD mouse; cardiac adaptations; cardiovascular; cardiovascular system; developmental origins of health and disease; diabetes; pregnancy.
Figures
Similar articles
-
Fetal cardiovascular hemodynamics in type 1 diabetic pregnancies at near-term gestation.Acta Obstet Gynecol Scand. 2021 Feb;100(2):263-271. doi: 10.1111/aogs.13987. Epub 2020 Sep 24. Acta Obstet Gynecol Scand. 2021. PMID: 32880890
-
Paired maternal and fetal cardiac functional measurements in women with gestational diabetes mellitus at 35-36 weeks' gestation.Am J Obstet Gynecol. 2020 Oct;223(4):574.e1-574.e15. doi: 10.1016/j.ajog.2020.04.019. Epub 2020 Apr 23. Am J Obstet Gynecol. 2020. PMID: 32335051
-
Placental growth factor influences maternal cardiovascular adaptation to pregnancy in mice.Biol Reprod. 2015 Feb;92(2):44. doi: 10.1095/biolreprod.114.124677. Epub 2014 Dec 23. Biol Reprod. 2015. PMID: 25537372 Free PMC article.
-
Effect of maternal diabetes on fetal heart function on echocardiography: systematic review and meta-analysis.Ultrasound Obstet Gynecol. 2021 Apr;57(4):539-550. doi: 10.1002/uog.22163. Ultrasound Obstet Gynecol. 2021. PMID: 32730637 Free PMC article.
-
Fetal Strain and Strain Rate Measured with Speckle Tracking Echocardiography in Maternal Diabetes: Systematic Review.Fetal Diagn Ther. 2024;51(6):525-538. doi: 10.1159/000538413. Epub 2024 Jul 17. Fetal Diagn Ther. 2024. PMID: 38934164
Cited by
-
Maternal Hyperglycemia Induces Changes in Gene Expression and Morphology in Mouse Placentas.Gynecol Reprod Health. 2021;5(1):10.33425/2639-9342.1140. doi: 10.33425/2639-9342.1140. Gynecol Reprod Health. 2021. PMID: 34250501 Free PMC article.
-
Guidelines for assessing maternal cardiovascular physiology during pregnancy and postpartum.Am J Physiol Heart Circ Physiol. 2024 Jul 1;327(1):H191-H220. doi: 10.1152/ajpheart.00055.2024. Epub 2024 May 17. Am J Physiol Heart Circ Physiol. 2024. PMID: 38758127 Free PMC article. Review.
-
NOD Mice Recapitulate the Cardiac Disturbances Observed in Type 1 Diabetes.J Cardiovasc Transl Res. 2021 Apr;14(2):271-282. doi: 10.1007/s12265-020-10039-y. Epub 2020 May 28. J Cardiovasc Transl Res. 2021. PMID: 32468298
References
-
- Crowther CA, Hiller JE, Moss JR, McPhee AJ, Jeffries WS, Robinson JS. Effect of treatment of gestational diabetes mellitus on pregnancy outcomes. N Engl J Med. 2005;352:2477–2486. - PubMed
-
- Hay WW., Jr Care of the Infant of the Diabetic Mother. Curr Diab Rep. 2011 - PubMed
-
- Tarquini R, Lazzeri C, Pala L, Rotella CM, Gensini GF. The diabetic cardiomyopathy. Acta Diabetol. 2011;48:173–181. - PubMed
Publication types
MeSH terms
Grants and funding
LinkOut - more resources
Full Text Sources
Other Literature Sources
Medical
Molecular Biology Databases
