. 2013 Aug;23(8):1210-23.
doi: 10.1101/gr.152306.112. Epub 2013 May 1.

Enhancer transcripts mark active estrogen receptor binding sites

Affiliations

Enhancer transcripts mark active estrogen receptor binding sites

Nasun Hah et al. Genome Res. 2013 Aug.

Abstract

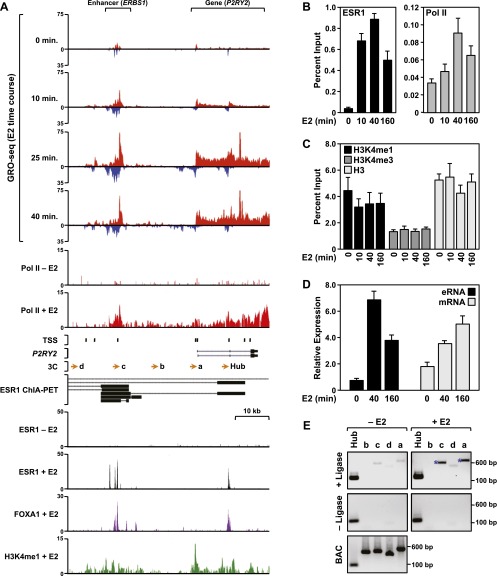
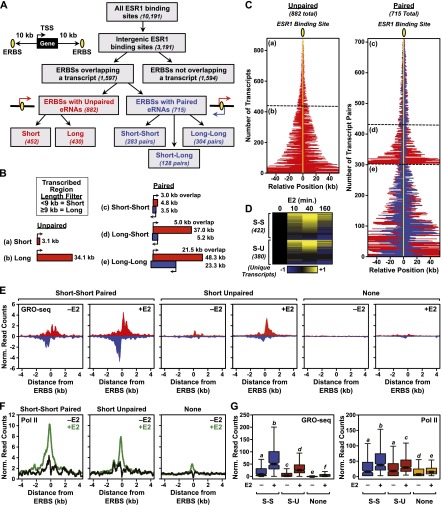
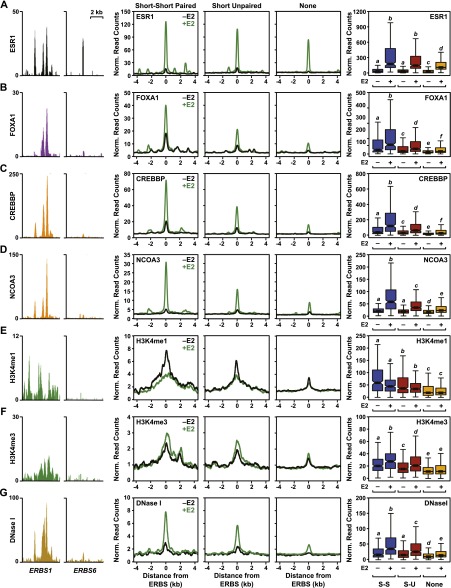
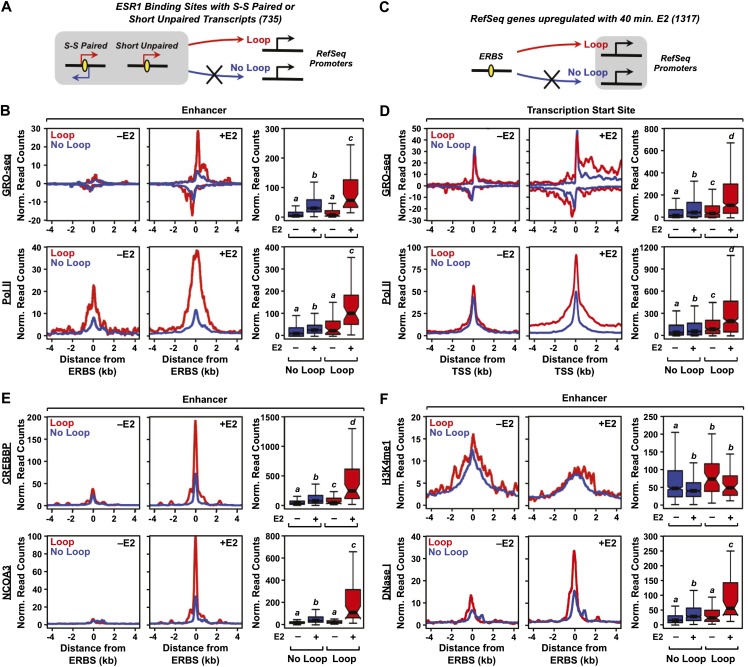
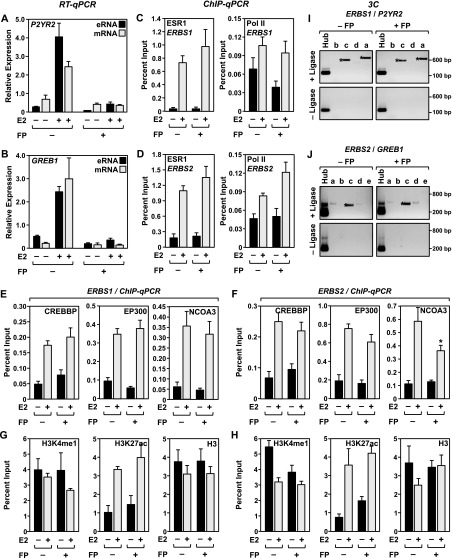
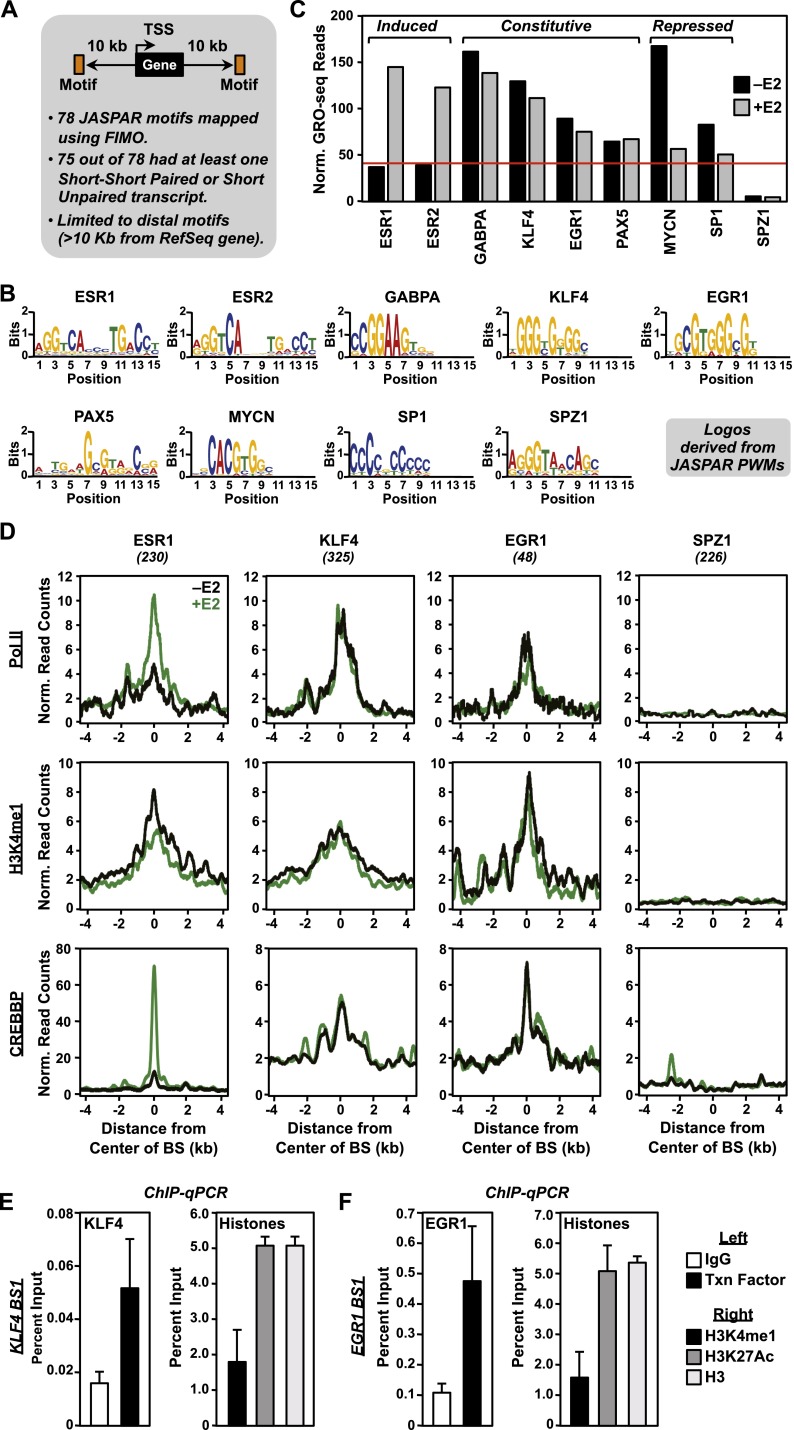
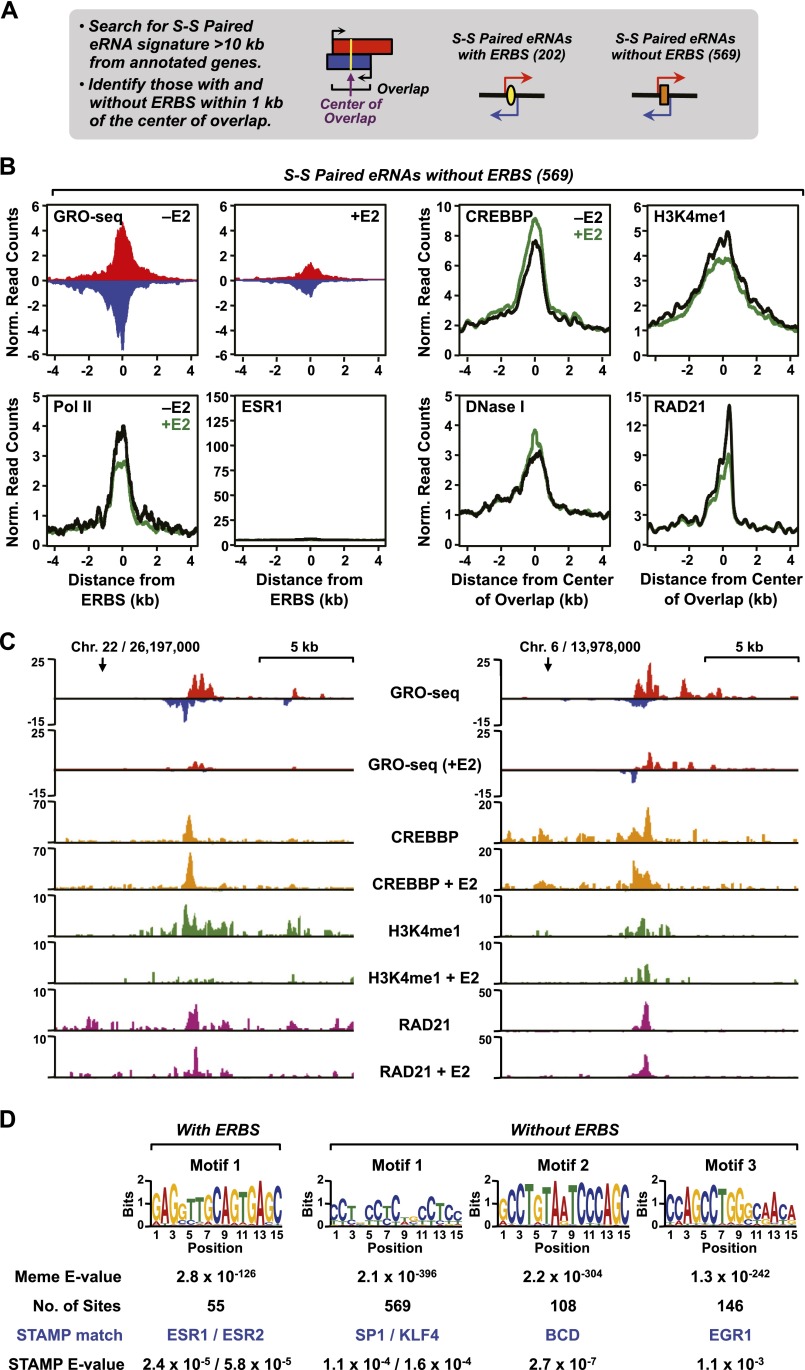
We have integrated and analyzed a large number of data sets from a variety of genomic assays using a novel computational pipeline to provide a global view of estrogen receptor 1 (ESR1; a.k.a. ERα) enhancers in MCF-7 human breast cancer cells. Using this approach, we have defined a class of primary transcripts (eRNAs) that are transcribed uni- or bidirectionally from estrogen receptor binding sites (ERBSs) with an average transcription unit length of ∼3-5 kb. The majority are up-regulated by short treatments with estradiol (i.e., 10, 25, or 40 min) with kinetics that precede or match the induction of the target genes. The production of eRNAs at ERBSs is strongly correlated with the enrichment of a number of genomic features that are associated with enhancers (e.g., H3K4me1, H3K27ac, EP300/CREBBP, RNA polymerase II, open chromatin architecture), as well as enhancer looping to target gene promoters. In the absence of eRNA production, strong enrichment of these features is not observed, even though ESR1 binding is evident. We find that flavopiridol, a CDK9 inhibitor that blocks transcription elongation, inhibits eRNA production but does not affect other molecular indicators of enhancer activity, suggesting that eRNA production occurs after the assembly of active enhancers. Finally, we show that an enhancer transcription "signature" based on GRO-seq data can be used for de novo enhancer prediction across cell types. Together, our studies shed new light on the activity of ESR1 at its enhancer sites and provide new insights about enhancer function.


Figures

Figure 1.
Figure 1.
The ESR1 enhancer of the estrogen-responsive P2RY2 gene produces bidirectional transcripts in MCF-7 cells. (A) Browser tracks of GRO-seq, ChIP-seq (Pol II, ESR1, FOXA1, and H3K4me1), ChIA-PET, TSS locations, and gene annotation for P2RY2 and its distal ESR1 binding site (ERBS1). The data are from MCF-7 cells treated with a time course of E2 (GRO-seq) or a single time point of E2 (45 or 60 min). TSSs identified previously based on a published data set from MCF-7 cells (Yamashita et al. 2011) are located as indicated. (Orange arrows) The locations of primers used for 3C assays. The black bars shown for the ChIA-PET data indicate the “head” and “tail” making contact in the gene loops, which are indicated by the dotted black lines. Scale bars show the length of the indicated region. A more detailed set of genomic data for P2RY2, as well as data for additional enhancer/gene pairs, can be found in Supplemental Figures 1 and 2. (B,C) ChIP-qPCR analyses showing recruitment of ESR1 and Pol II (B) or levels of H3K4me1, me3, and H3 (C) at ERBS1 in response to a time course of E2 treatment. Each bar represents the mean + the SEM for three or more independent biological replicates. (D) RT-qPCR analyses showing the expression of ERBS1 eRNA and P2RY2 mRNA in response to a time course of E2 treatment. Each bar represents the mean + the SEM for three or more independent biological replicates. (E) 3C-PCR assay showing E2-induced looping between ERBS1 and the P2RY2 gene. The lowercase letters correspond to the primers denoted by orange arrows shown in panel A. The assays were conducted in the presence (experimental) or absence (control) of DNA ligase, as indicated. Digested and ligated bacterial artificial chromosome (BAC) DNA spanning the entire P2YR2 locus was used as a PCR control. The size of the PCR fragments in base pairs is shown. One representative experiment from three conducted is shown.
Figure 2.
Figure 2.
Genome-wide identification of ESR1 enhancer transcripts in MCF-7 cells using GRO-seq. (A) Flowchart of ERBS classification in MCF-7 cells based on genomic location, eRNA production, and length of the transcribed region based on ChIP-seq and GRO-seq. (B) Schematics of average transcribed regions overlapping ERBSs in MCF-7 cells in five classes: (a) short unpaired, (b) long unpaired, (c) short–short paired, (d) long–short paired, and (e) long–long paired. “Short” and “Long” indicate a transcribed region <9 kb or ≥9 kb, respectively. (Red and blue boxes) Transcription from opposite strands. (C) Graphical representation of the positions and orientations of eRNAs (indicated by red and blue lines) relative to ESR1 binding sites (indicated by yellow oval and line) for unpaired and paired eRNAs in MCF-7 cells. The position relative to the ERBS is indicated in kilobases. (a–e) Correspond to the categories shown in panel B. (Red and blue lines) Transcription from opposite strands. (D) Heat map showing the expression of E2-regulated short unpaired (S-U) and short–short paired (S-S) eRNAs over a time course of E2 treatment in MCF-7 cells based on GRO-seq data. The data were median centered and scaled to the 0-min time point. Yellow and blue indicate up-regulated and down-regulated transcripts, respectively. Only unique transcripts are shown (i.e., those transcripts that overlap more than one ERBS are represented once). (E) Metaplot analyses of GRO-seq reads surrounding ERBSs associated with short–short paired transcripts, short unpaired transcripts, or no transcripts in MCF-7 cells ± E2 treatment. (F) Metaplot analyses of Pol II ChIP-seq reads surrounding ERBSs associated with short–short paired transcripts, short unpaired transcripts, or no transcripts in MCF-7 cells ± E2 treatment. (G) Box plot representation of GRO-seq and Pol II ChIP-seq reads associated with short–short paired transcripts (S-S), short unpaired transcripts (S-U), or no transcripts in MCF-7 cells ± E2 treatment.
Figure 3.
Figure 3.
The production of eRNAs from ERBSs positively correlates with the recruitment of coactivators, the levels of histone modifications, and the chromatin state in MCF-7 cells. Browser tracks, metaplots, and boxplots showing a positive correlation between eRNA production at ERBS with known markers of enhancer function. (Left two panels) Browser track representations of coactivator or histone modification ChIP-seq data, or DNase-seq data, as indicated on the y-axis for ERBS1 and ERBS6. (Middle three panels) Metaplot analyses of ChIP-seq or DNase-seq read counts for sets of ERBSs with short–short paired, short unpaired, or no transcripts in the presence (green line) or absence (black line) of E2 treatment. (Right panel) Box plot representations of ChIP-seq or DNase-seq data for sets of ERBSs with short–short paired (blue boxes), short unpaired (maroon boxes), or no transcripts (orange boxes) in the presence (+) or absence (−) of E2 treatment. (A) ESR1 ChIP-seq. (B) FOXA1 ChIP-seq. (C) CREBBP ChIP-seq. (D) NCOA3 ChIP-seq. (E) H3K4me1 ChIP-seq. (F) H3K4me3 ChIP-seq. (G) DNase-seq.
Figure 4.
Figure 4.
The production of eRNAs from ERBSs positively correlates with enhancer looping to target genes in MCF-7 cells. (A,C) Schematics of the looping analyses based on ESR1 ChIA-PET data. ERBSs (enhancers) were queried to determine if they loop to the promoters of RefSeq genes, based on ESR1 ChIA-PET data. Looping was assayed within a 2-kb (±1 kb) window around ESR1 peak centers and a 10-kb (±5 kb) window around the TSSs of target genes. (B) Metaplots and boxplots for GRO-seq (top) and Pol II ChIP-seq (bottom) data for ERBSs that either loop to (Loop, red lines) or do not loop to (No Loop, blue lines) target gene promoters. (D) Metaplots and boxplots for GRO-seq (top) and Pol II ChIP-seq (bottom) data for target gene promoters that are either looped to (Loop, red lines) or are not looped to (No Loop, blue lines) ERBSs. (E) Metaplots and boxplots for CREBBP ChIP-seq (top) and NCOA3 ChIP-seq (bottom) data for ERBSs that either loop to (Loop, red lines) or do not loop to (No Loop, blue lines) target gene promoters. (F) Metaplots and boxplots for H3K4me1 ChIP-seq ChIP-seq (top) and DNase-seq (bottom) data for ERBSs that either loop to (Loop, red lines) or do not loop to (No Loop, blue lines) target gene promoters.
Figure 5.
Figure 5.
Inhibition of eRNA production by flavopiridol does not inhibit ESR1, Pol II, or coregulator binding, alter H3K4me1 or H3K27ac levels, or prevent enhancer looping at ERBSs in MCF-7 cells. Locus-specific assays for E2-responsive enhancers showing the effects of a 1-h pre-treatment with flavopiridol (FP) on various molecular outcomes in MCF-7 cells. Each bar represents the mean + the SEM for three or more independent biological replicates. (A,B) Treatment with flavopiridol inhibits the E2-dependent production and steady-state accumulation of eRNAs and target gene mRNAs. RT-qPCR analyses for selected eRNAs and mRNAs in response to E2 treatment. (A) ERBS1 eRNA/P2RY2 mRNA and (B) ERBS2 eRNA/GREB1 mRNA. (C,D) ChIP-qPCR analyses for ESR1 (left) and Pol II (right) for ERBS1 (C) and ERBS2 (D) in the absence or presence of E2 and flavopiridol, as indicated. (E,F) ChIP-qPCR analyses for CREBBP (left), EP300 (middle), and Pol II (right) for ERBS1 (E) and ERBS2 (F) in the absence or presence of E2 and flavopiridol, as indicated. (G,H) ChIP-qPCR analyses for H3K4me1 (left), H3K27ac (middle), and H3 (right) for ERBS1 (G) and ERBS2 (H) in the absence or presence of E2 and flavopiridol, as indicated. (I,J) 3C-PCR analyses showing that looping between distal ERBSs and target genes in the presence of E2 is not blocked by flavopiridol (FP). (I) ERBS1/P2RY2 and (J) ERBS2/GREB1. The lowercase letters correspond to the primers denoted by orange arrows shown in Figure 1A. The assays were conducted in the presence (experimental) or absence (control) of DNA ligase, as indicated. The size of the PCR fragments in base pairs is shown. One representative experiment from three conducted is shown.
Figure 6.
Figure 6.
Directed search for ESR1 and non-ESR1 enhancers in MCF-7 cells using GRO-seq data. (A) Schematic of the directed enhancer search using GRO-seq data. Seventy-eight motifs from the JASPAR database were mapped to the human genome using FIMO. For all intergenic motifs (>10 kb from RefSeq genes) with eRNAs (either short–short paired or short unpaired) originating within a 2-kb window around the center of the motif (i.e., ±1 kb relative to the motif), we collected the GRO-seq reads within a 1-kb window around the center of the motif (i.e., ±0.5 kb relative to the motif) and normalized them to the total number of occurrences of the motif. (B) Bar graph showing the normalized GRO-seq read count density per occurrence for nine selected motifs from the JASPAR database ± E2. (C) Web logos for the nine selected motifs shown in panel B generated using the JASPAR position weight matrices (PWMs). (D) Metaplots of Pol II, H3K4me1, and CREBBP ChIP-seq data from MCF-7 cells treated with (green lines) or without (black lines) E2 for four selected motifs from panel B. (E,F) ChIP-qPCR assays of KLF4 (E) and EGR1 (F) binding (left panels) and enhancer-associated histone modifications (H3K4me1 and H3K27ac; right panels) at cognate predicted binding sites. Each bar represents the mean + SEM for three or more independent biological replicates.
Figure 7.
Figure 7.
Unbiased search for ESR1 and non-ESR1 enhancers in MCF-7 cells using GRO-seq data. (A) Schematic of the unbiased enhancer search using GRO-seq data. All intergenic (>10 kb away from the start or end of an annotated RefSeq gene) short–short paired eRNAs <9 kb and with an average overlap of 3 kb were identified in the set of called transcripts from MCF-7 cells. (B) GRO-seq data, Pol II, ESR1, CREBBP, H3K4me1, and RAD21 ChIP-seq data, and DNase-seq data (as indicated) from the analysis described in panel A were collected, mapped relative to the center of the plus and minus strand overlap of the short–short paired eRNAs, and expressed as metaplots. (C) Browser tracks of GRO-seq and selected ChIP-seq data for two enhancers without ERBSs identified in the unbiased search described in panel A. (D) Web logos and statistical parameters for the top motifs identified in a search of enhancers identified in panel A. All occurrences of the short–short paired transcripts were collected and subjected to motif analysis. De novo motif searching was performed on a 1-kb region around the center of the plus and minus strand overlap (±500 bp) using MEME. The predicted motifs from MEME were matched to known motifs using STAMP.

References

    1. Akhtar-Zaidi B, Cowper-Sal-lari R, Corradin O, Saiakhova A, Bartels CF, Balasubramanian D, Myeroff L, Lutterbaugh J, Jarrar A, Kalady MF, et al. 2012. Epigenomic enhancer profiling defines a signature of colon cancer. Science 336: 736–739 - PMC - PubMed
    1. Bailey TL, Elkan C 1994. Fitting a mixture model by expectation maximization to discover motifs in biopolymers. Proc Int Conf Intell Syst Mol Biol 2: 28–36 - PubMed
    1. Bailey TL, Boden M, Buske FA, Frith M, Grant CE, Clementi L, Ren J, Li WW, Noble WS 2009. MEME SUITE: Tools for motif discovery and searching. Nucleic Acids Res 37: W202–W208 - PMC - PubMed
    1. Bryne JC, Valen E, Tang MH, Marstrand T, Winther O, da Piedade I, Krogh A, Lenhard B, Sandelin A 2008. JASPAR, the open access database of transcription factor-binding profiles: New content and tools in the 2008 update. Nucleic Acids Res 36: D102–D106 - PMC - PubMed
    1. Bulger M, Groudine M 2011. Functional and mechanistic diversity of distal transcription enhancers. Cell 144: 327–339 - PMC - PubMed

Publication types

Associated data