. 2013 Jun 13;121(24):4884-93.
doi: 10.1182/blood-2012-05-432252. Epub 2013 May 1.

Defective K-Ras oncoproteins overcome impaired effector activation to initiate leukemia in vivo

Affiliations

Defective K-Ras oncoproteins overcome impaired effector activation to initiate leukemia in vivo

Angell Shieh et al. Blood. .

Abstract

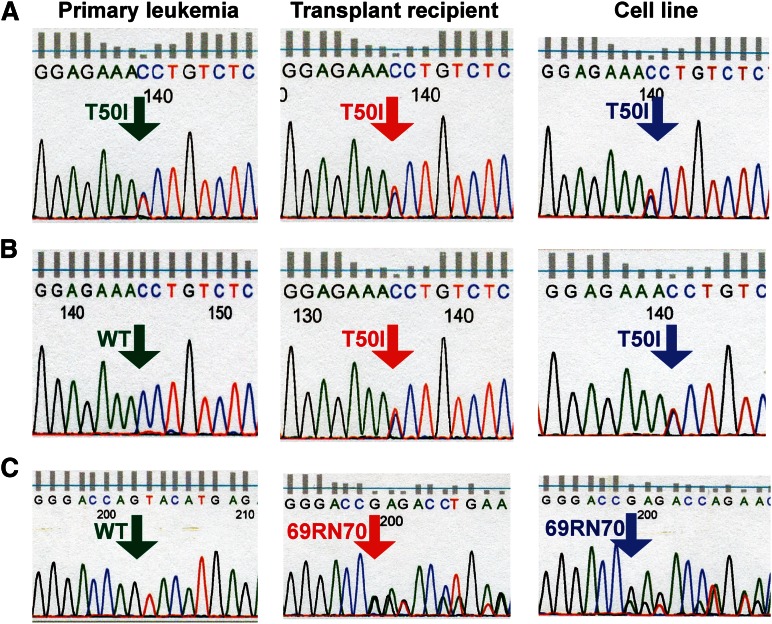
Reversing the aberrant biochemical output of oncogenic Ras proteins is one of the great challenges in cancer therapeutics; however, it is uncertain which Ras effectors are required for tumor initiation and maintenance. To address this question, we expressed oncogenic K-Ras(D12) proteins with "second site" amino acid substitutions that impair PI3 kinase/Akt or Raf/MEK/ERK activation in bone marrow cells and transplanted them into recipient mice. In spite of attenuated signaling properties, defective K-Ras oncoproteins initiated aggressive clonal T-lineage acute lymphoblastic leukemia (T-ALL). Murine T-ALLs expressing second site mutant proteins restored full oncogenic Ras activity through diverse mechanisms, which included acquiring novel somatic third site Kras(D12) mutations and silencing PTEN. T-ALL cell lines lacking PTEN had elevated levels of phosphorylated Akt, a gene expression pattern similar to human early T-cell precursor ALL, and were resistant to the potent and selective MEK inhibitor PD0325901. Our data, which demonstrate strong selective pressure to overcome the defective activation of PI3 kinase/Akt and Raf/MEK/ERK, implicate both Ras effector pathways as drivers of aberrant growth in T-ALL and further suggest that leukemia cells will deploy multiple mechanisms to develop resistance to targeted inhibitors in vivo.


Figures

Figure 1
Figure 1
Second site KrasD12 mutant alleles induce hypersensitive myeloid progenitor growth and initiate T-ALL. (A) CFU-GM formation by fetal liver cells expressing WT Kras (●), KrasD12 (▪), KrasD12/G37 (▲), or KrasD12/G64 (♦). Mean ± standard error of the mean (SEM) of 5 independent experiments is shown. Data points marked with an asterisk (*) are significantly different from WT by paired, 1-tailed t test (P < .05). (B) Signaling in transfected COS-7 cells under basal (B), starved (S), and EGF-stimulated (E) conditions. (C) Signaling in transduced S49 cells under starved conditions. These cells were infected with MSCV-GFP-Kras vectors and sorted to equalize Ras expression levels. GFP-K-Ras fusion proteins run at a different molecular weight than endogenous Ras proteins. (D) Morphology of 3T3 cells expressing WT Kras, KrasD12, KrasD12/G37, or KrasD12/G64. Note that KrasD12 and KrasD12/G64 induce morphologic changes. (E) Survival of lethally irradiated WT mice transplanted with bone marrow cells transduced with MIG vector (×; n = 8) or MIG vectors expressing WT Kras (●; n = 10), KrasD12 (▪; n = 9), KrasD12/G37 (▲; n = 15), or KrasD12/G64 (♦; n = 14). (F) White blood cell (WBC) counts at death in recipients of bone marrow transduced with MIG vector (n = 8), KrasD12/G37 (n = 15), or KrasD12/G64 (n = 14) viruses. Data plotted as mean ± SEM, with an asterisk (*) indicating data points significantly different from WT by unpaired, 1-tailed t test (P < .05). (G) Peripheral blood smear showing blast morphology in a mouse with T-ALL.
Figure 2
Figure 2
Leukemias initiated by KrasD12/G37 and KrasD12/G64 expression demonstrate distinct signaling profiles. (A) Immunoblot of T-ALL cell lines under basal (B) and starved (S) conditions. Two control T-ALL cell lines with WT Kras (C) from a retroviral insertional mutagenesis screen were included. Ten cell lines were generated from independent leukemias induced by either KrasD12/G37 (E1-E4) or KrasD12/G64 (Y1-Y6). (B) Ras was immunoprecipitated from cell lines E1-E4 and then probed with an antibody that recognizes the D12 substitution. (C) quantitative PCR analysis of Kras expression in T-ALL cell lines compared with WT thymus.
Figure 3
Figure 3
Somatic third site Kras mutations in T-ALL. In cell lines E1 (A) and E3 (B), the single amino acid substitution T50I was present at ∼50% frequency based on relative abundance of sequence reads. It was detected at a similar frequency in the spleens of the secondary recipients used to generate these cell lines and in a single primary recipient. (C) The sequence GAGACC was inserted between amino acids 69 and 70 of Kras in T-ALL cell line Y4. This mutation is present in ∼50% of Kras transcripts in cell line Y4, at a lower frequency in the spleen of the secondary recipient used to generate this cell line, and is not seen in the primary leukemia.
Figure 4
Figure 4
Acquired third site mutations restore oncogenic activity to KrasD12/G37 and KrasD12/G64. (A) CFU-GM formation of fetal liver cells expressing WT Kras (●), KrasD12 (▪), KrasD12/G37/I50 (Δ), or KrasD12/G64/69RN70 (♢). Data show the mean of 3 independent experiments. (B) Representative CFU-GM morphology from fetal liver cells expressing Kras mutant alleles grown in 0.1 ng/mL GM-CSF. (C) Ras expression in GFP+, Mac1+ fetal liver cells infected with MSCV viruses encoding different Kras alleles. (D) Levels of pERK, pAkt, and pS6 in GFP+, Mac1+ fetal liver cells infected with MSCV viruses encoding different Kras alleles, as determined by flow cytometry using phospho-specific antibodies. Phospho-protein levels in cells expressing WT K-Ras were set at 1 in each experiment. Data shown are derived from 6 independent experiments.
Figure 5
Figure 5
PTEN loss confers resistance to inhibition of MEK but not PI3K or Akt. IC50s and mean growth curves of T-ALL cell lines with and without PTEN expression in varying doses of (A) the PI3K inhibitor GDC-0941, (B) the Akt inhibitor MK2206, and (C) the MEK inhibitor PD0325901. (D) PD0325901 induces apoptosis in PTEN-positive, but not PTEN-negative, cell lines. Curves indicate mean growth of 4 PTEN-positive cell lines (E1, E2, E3, and Y4) and 6 PTEN-negative cell lines (E4, Y1, Y2, Y3, Y5, and Y6) ± SEM. ***P < .001, *P < .05.
Figure 6
Figure 6
PI3K-activated T-ALL cell lines and human ETP ALLs have similar gene expression profiles. (A) Principal component analysis of the gene expression profiling data of all 10 mouse T-ALL cell lines using 200 representative genes selected by k-means algorithm, showing cases clustered according to PI3K activation status (red, activated; blue, not activated). (B) Gene set enrichment analysis demonstrates significant enrichment of the top 100 mouse PI3K up-regulated genes in ETP ALL (P = .057; false discovery rate, 0.224). (C) Heat map of the leading-edge mouse PI3K up-regulated genes in gene set enrichment analysis, showing overexpression of these genes in ETP ALL.

References

    1. Schubbert S, Bollag G, Lyubynska N, et al. Biochemical and functional characterization of germ line KRAS mutations. Mol Cell Biol. 2007;27(22):7765–7770. - PMC - PubMed
    1. Vetter IR, Wittinghofer A. The guanine nucleotide-binding switch in three dimensions. Science. 2001;294(5545):1299–1304. - PubMed
    1. Donovan S, Shannon KM, Bollag G. GTPase activating proteins: critical regulators of intracellular signaling. Biochim Biophys Acta. 2002;1602(1):23–45. - PubMed
    1. Maurer T, Garrenton LS, Oh A, et al. Small-molecule ligands bind to a distinct pocket in Ras and inhibit SOS-mediated nucleotide exchange activity. Proc Natl Acad Sci USA. 2012;109(14):5299–5304. - PMC - PubMed
    1. Downward J. Targeting RAS signalling pathways in cancer therapy. Nat Rev Cancer. 2003;3(1):11–22. - PubMed

Publication types

MeSH terms

Associated data