. 2013 May 1;33(18):7691-9.
doi: 10.1523/JNEUROSCI.3905-12.2013.

Feature-specific information processing precedes concerted activation in human visual cortex

Affiliations

Feature-specific information processing precedes concerted activation in human visual cortex

Pavan Ramkumar et al. J Neurosci. .

Abstract

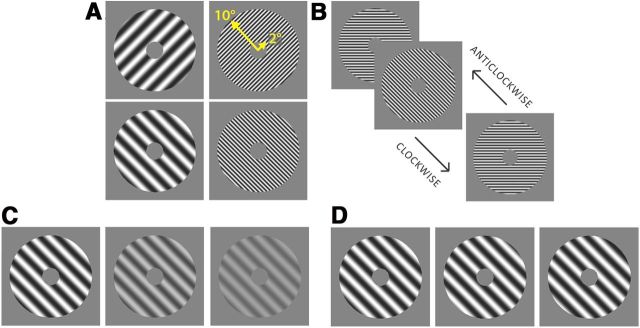
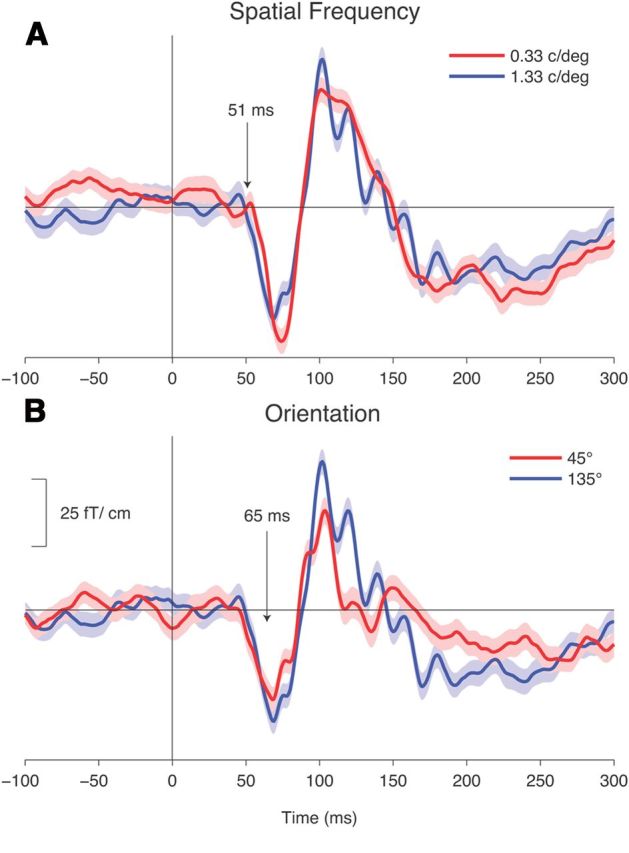
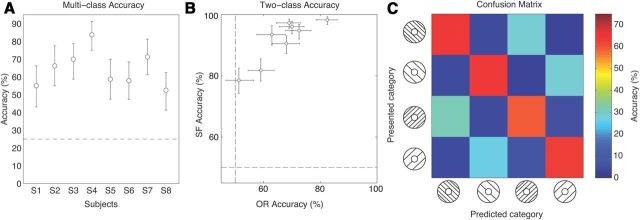
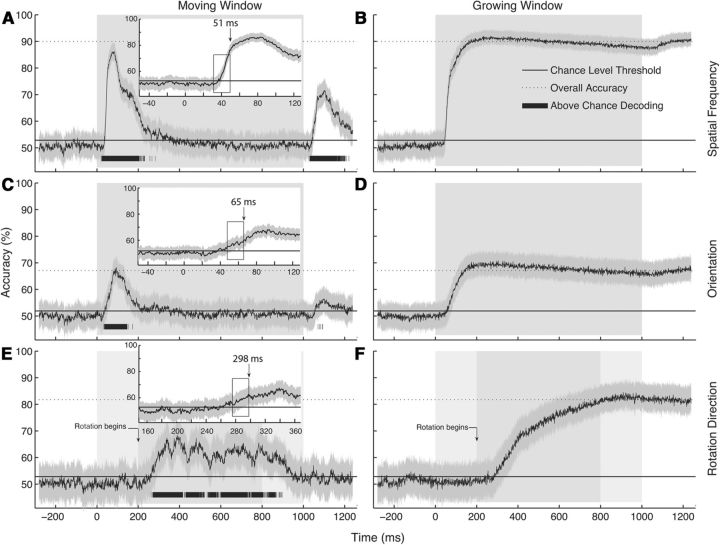
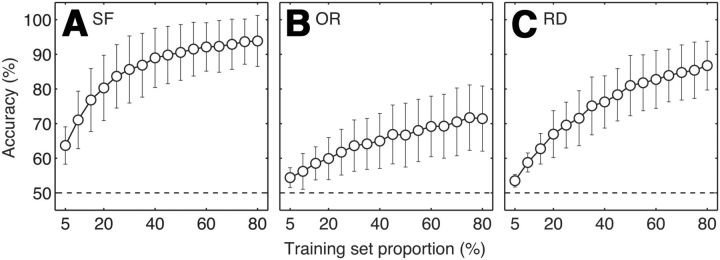
Current knowledge about the precise timing of visual input to the cortex relies largely on spike timings in monkeys and evoked-response latencies in humans. However, quantifying the activation onset does not unambiguously describe the timing of stimulus-feature-specific information processing. Here, we investigated the information content of the early human visual cortical activity by decoding low-level visual features from single-trial magnetoencephalographic (MEG) responses. MEG was measured from nine healthy subjects as they viewed annular sinusoidal gratings (spanning the visual field from 2 to 10° for a duration of 1 s), characterized by spatial frequency (0.33 cycles/degree or 1.33 cycles/degree) and orientation (45° or 135°); gratings were either static or rotated clockwise or anticlockwise from 0 to 180°. Time-resolved classifiers using a 20 ms moving window exceeded chance level at 51 ms (the later edge of the window) for spatial frequency, 65 ms for orientation, and 98 ms for rotation direction. Decoding accuracies of spatial frequency and orientation peaked at 70 and 90 ms, respectively, coinciding with the peaks of the onset evoked responses. Within-subject time-insensitive pattern classifiers decoded spatial frequency and orientation simultaneously (mean accuracy 64%, chance 25%) and rotation direction (mean 82%, chance 50%). Classifiers trained on data from other subjects decoded the spatial frequency (73%), but not the orientation, nor the rotation direction. Our results indicate that unaveraged brain responses contain decodable information about low-level visual features already at the time of the earliest cortical evoked responses, and that representations of spatial frequency are highly robust across individuals.


Figures

Figure 1.
Figure 1.
All stimuli used in the study were sinusoidal gratings within annuli spanning the full visual field at eccentricities between 2° and 10°. A, In the static-grating experiment, stimuli were of two distinct SFs (left, 0.33 c/deg; right, 1.33 c/deg) and two distinct ORs (top, 45°; bottom, 135°). B, In the rotating-grating experiment, gratings with an SF of 1.33 c/deg rotated either clockwise or anticlockwise in the range of 0–180°. C, In the cross-contrast decoding experiment, static gratings oriented at 135° were presented at full, half, and one-fourth contrasts. D, In the cross-phase decoding experiment, static gratings, oriented at 135°, were presented at zero, quarter-cycle, and half-cycle phase shifts.
Figure 2.
Figure 2.
A, The average photodiode responses to 100 trials each of black (black trace) and white (gray trace) stimulus patches were averaged with respect to the stimulus trigger (gray vertical dashed line). The photodiode signal begins to change 36 ms after the stimulus trigger, as indicated by the arrow on the top left. The dotted lines indicate the region near the photodiode signal onset, from which the signal in the inset is displayed. The inset shows the 2 ms rise time to maximum luminance. B, Time-resolved decoding of the stimulus patch color from the single-trial photodiode responses. C, Time-resolved decoding of SF from a single subject's single-trial filtered (gray) and unfiltered (black) MEG responses.
Figure 3.
Figure 3.
Evoked responses to static gratings. Responses averaged across 100 trials for a representative subject's parieto-occipital planar gradiometer. A, Low (0.33 c/deg; red) and high (1.33 c/deg; blue) spatial frequencies for gratings oriented at 135°. B, Gratings oriented at 45° (red) and 135° (blue), both at 1.33 c/deg. Shaded boundaries show SEMs. Arrows show the median onset of above-chance decoding accuracy (see Results, Time-resolved decoding of visual features and Fig. 5).
Figure 4.
Figure 4.
Time-insensitive decoding. A, Subjectwise classification accuracies for the four-class decoding problem: identification of both SF and OR from a closed set. The chance level (25%) is given as a dashed line. Error bars indicate bootstrapped 95% CIs. B, Decoding accuracies for the two-class problem: OR (x-axis) versus SF (y-axis). Each circle represents one subject; error bars indicate bootstrapped 95% CIs. C, Confusion matrix for the four-class decoding problem, viz. prediction of OR and SF. Individual confusion matrices estimated from each subject and cross-validation fold were averaged. Entries in each row show percentage of trials predicted as the category corresponding to the respective column. Chance level is 25%. The categories—indicated by schematics depicting the stimulus features—correspond to left-oriented (135°) high SF, left-oriented low SF, right-oriented (45°) high SF, and right-oriented low SF.
Figure 5.
Figure 5.
Time-resolved decoding. Performance of time-resolved classifiers using windows moving or growing in 1 ms time steps is shown. The moving and growing window traces for SF (A, B), OR (C, D), and RD (E, F) are shown, along with chance-level threshold as solid lines and overall accuracies from time-insensitive classifiers as dotted lines. The bounds on each trace indicate bootstrapped 95% CIs across eight subjects. Subjectwise accuracy traces were themselves obtained by averaging across five cross-validation folds. Black bars at the bottom of each trace show the duration in which above-chance decoding (p < 0.00005) was obtained. Insets in A, C, and E show the accuracy traces around the stimulus or rotation onset. Arrows within the insets indicate the leading edge of the windows at which chance level was first exceeded. The gray patches in A–D show the stimulus time course. The light gray patches for E and F between 0–200 ms and 800–1000 ms indicate the periods of contrast fade-in and fade-out of the grating, and the dark gray patches indicate the duration of rotation. The arrows in E and F show the onset of stimulus rotation.
Figure 6.
Figure 6.
Robustness analysis. Classification performance for the static and dynamic gratings as a function of the percentage of samples in the training set are shown. Accuracies are shown as a function of the number of training samples used to train the classifier. The proportion of samples in the training set was varied from 5 to 80%, and the remaining trials were used for testing. Accuracies are shown for (A) SFs, (B) ORs, and (C) RDs. Error bars indicate SD of the mean classification accuracies across the eight subjects.

Similar articles

Cited by

References

    1. Berens P, Ecker AS, Cotton RJ, Ma WJ, Bethge M, Tolias AS. A fast and simple population code for orientation in primate V1. J Neurosci. 2012;32:10618–10626. doi: 10.1523/JNEUROSCI.1335-12.2012. - DOI - PMC - PubMed
    1. Bisley JW, Krishna BS, Goldberg ME. A rapid and precise on-response in posterior parietal cortex. J Neurosci. 2004;24:1833–1838. doi: 10.1523/JNEUROSCI.5007-03.2004. - DOI - PMC - PubMed
    1. Bonhoeffer T, Grinvald A. Iso-orientation domains in cat visual cortex are arranged in pinwheel-like patterns. Nature. 1991;353:429–431. doi: 10.1038/353429a0. - DOI - PubMed
    1. Carlson TA, Hogendoorn H, Kanai R, Turret J. High temporal resolution decoding of object position and category. J Vis. 2011;11(10):9. doi: 10.1167/11.10.9. pii. - DOI - PubMed
    1. Chalupa LM, Werner JS. The visual neurosciences. Cambridge, MA: MIT; 2003.

Publication types

LinkOut - more resources