. 2013 May 1;33(18):7742-55.
doi: 10.1523/JNEUROSCI.3275-12.2013.

Primary hippocampal neurons, which lack four crucial extracellular matrix molecules, display abnormalities of synaptic structure and function and severe deficits in perineuronal net formation

Affiliations

Primary hippocampal neurons, which lack four crucial extracellular matrix molecules, display abnormalities of synaptic structure and function and severe deficits in perineuronal net formation

Maren Geissler et al. J Neurosci. .

Abstract

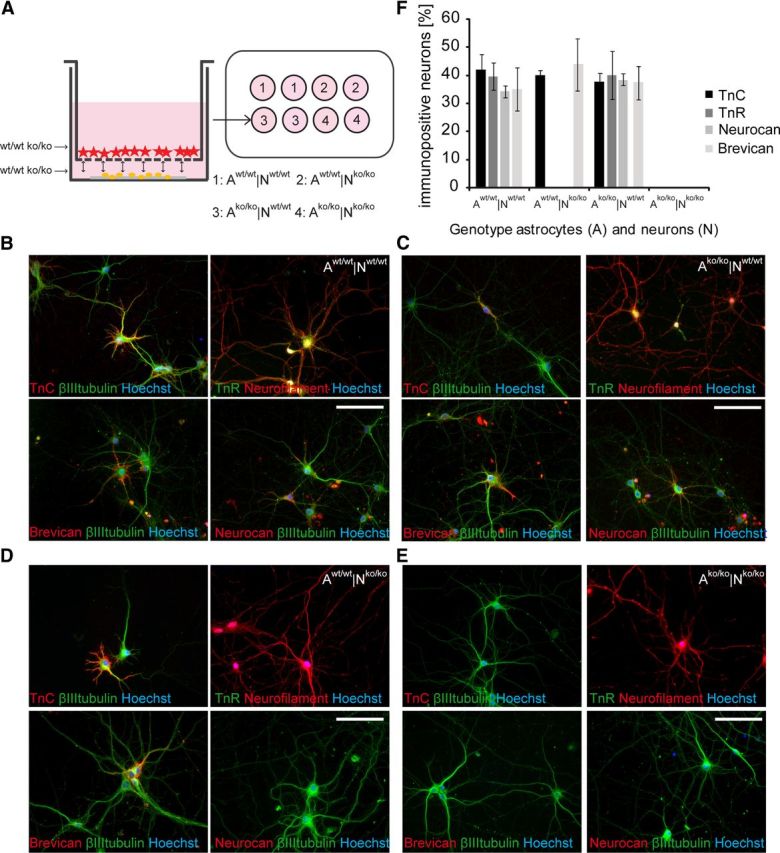
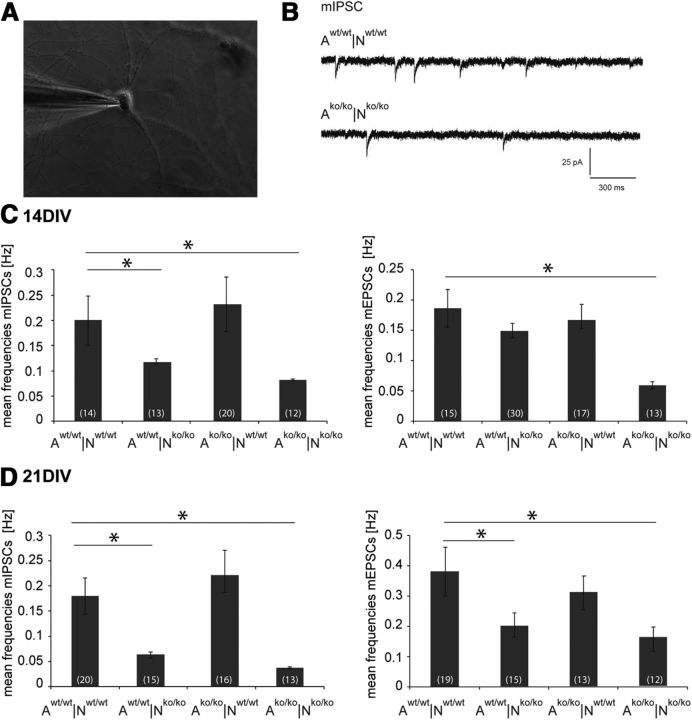
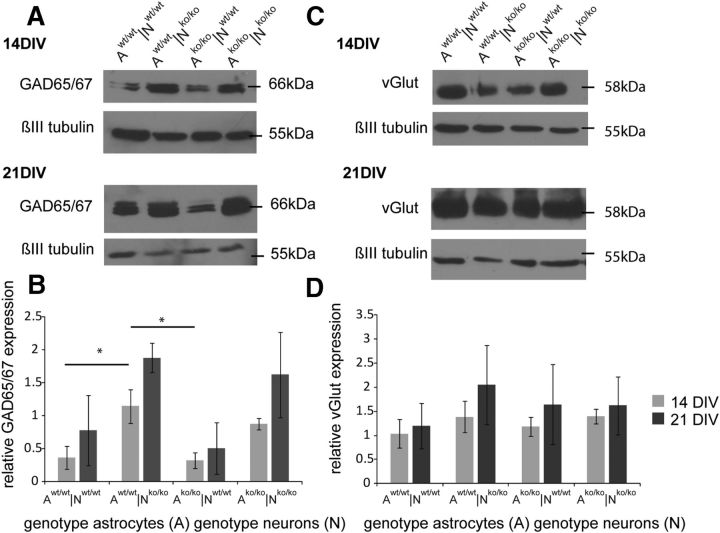
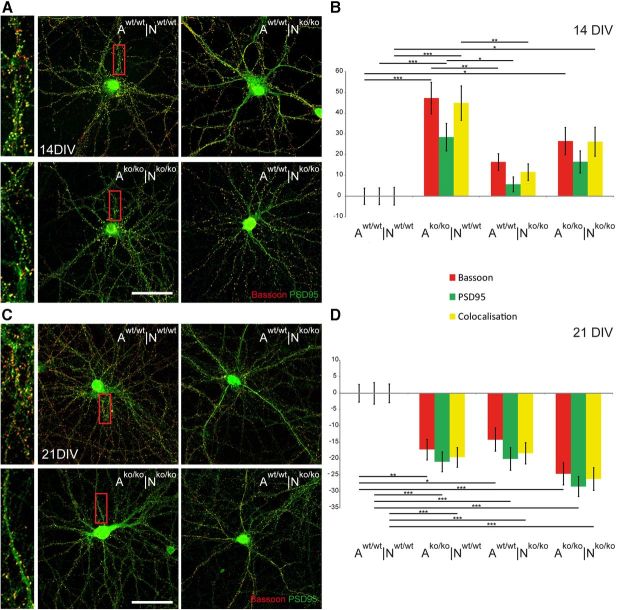
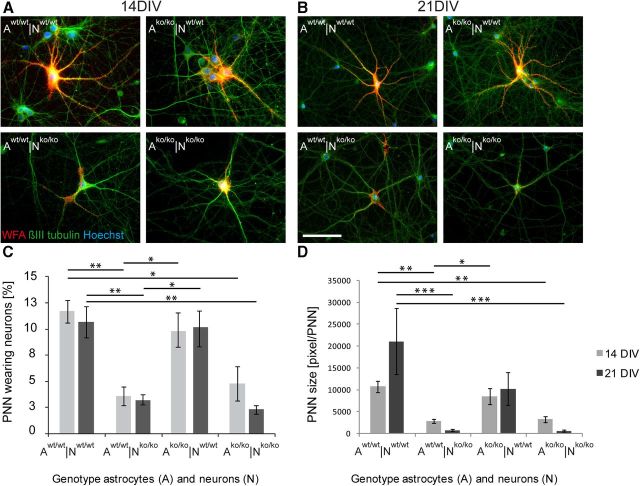
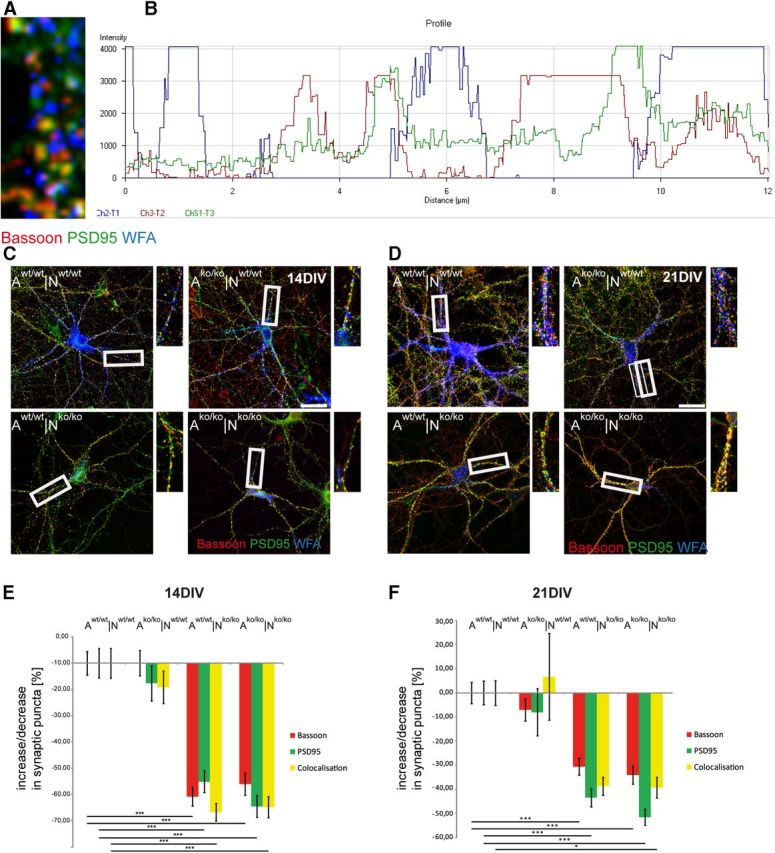
The extracellular matrix (ECM) of the brain plays crucial roles during the development, maturation, and regeneration of the CNS. In a subpopulation of neurons, the ECM condenses to superstructures called perineuronal nets (PNNs) that surround synapses. Camillo Golgi described PNNs a century ago, yet their biological functions remain elusive. Here, we studied a mouse mutant that lacks four ECM components highly enriched in the developing brain: the glycoproteins tenascin-C and tenascin-R and the chondroitin sulfate proteoglycans brevican and neurocan. Primary embryonic hippocampal neurons and astrocytes were cultivated using a cell insert system that allows for co-culture of distinct cell populations in the absence of direct membrane contacts. The wild-type and knock-out cells were combined in the four possible permutations. Using this approach, neurons cultivated in the presence of mutant astrocytes displayed a transient increase of synapses after 2 weeks. However, after a period of 3 weeks or longer, synapse formation and stabilization were compromised when either neuron or astrocyte cell populations or both were of mutant origin. The development of PNN structures was observed, but their size was substantially reduced on knock-out neurons. The synaptic activity of both wild-type and knock-out neurons was monitored using whole-cell patch clamping. The salient observation was a reduced frequency of IPSCs and EPSCs, whereas the amplitudes were not modified. Remarkably, the knock-out neuron phenotypes could not be rescued by wild-type astrocytes. We conclude that the elimination of four ECM genes compromises neuronal function.


Figures

Figure 1.
Figure 1.
Neuron-astrocyte co-culture setup and the expression of ECM molecules in vitro. A, Scheme of the indirect neuron-astrocyte co-culture setup. Astrocytes (red asterisk) were grown in a cell culture insert with a permeable membrane facing the neurons (yellow dots) and sharing the same, defined medium. The four neuron-astrocyte (N/A) genotype combinations used are indicated (1–4). BE, Immunofluorescent stainings of neurons co-cultured with astrocytes after 14 DIV in the different combinations with antibodies against Tnc, Tnr, brevican, and neurocan. Scale bar, 50 μm. F, Quantification of the staining. Scale bars represent the average fraction ± SEM. At least 100 neurons chosen at random were assessed per combination and 3 independent experiments were performed (N = 3, n ≥ 400).
Figure 2.
Figure 2.
Whole-cell voltage-clamp recordings of mIPSCs and mEPSCs in the four astrocyte-neuron culture combinations after 14 and 21 DIV. A, Photomicrograph of a representative primary hippocampal neuron (14 DIV) in whole-cell voltage-clamp recording at −60 mV. B, mIPSCs recorded from wild-type (Aw/w|Nw/w) and knock-out (Ako/ko|Nko/ko) cell culture combinations. For the pharmacological isolation of mIPSCs, tetrodotoxin (1 μm) and DNQX (10 μm) were added to the bath solution. C, Mean frequencies of mIPSCs and mEPSCs after 14 DIV were significantly decreased in the Aw/w|Nko/ko and Ako/ko|Nko/ko culture combinations. D, After 21 DIV, mIPSC and mEPSC mean frequencies of the Aw/w|Nko/ko and Ako/ko|Nko/ko combinations showed a significant reduction compared with control cultures. Data are represented as mean ± SEM. and were considered significantly different at p ≤ 0.05 using ANOVA. The respective n is indicated in brackets.
Figure 3.
Figure 3.
Expression levels of vGlut and GAD 65 and 67 in primary hippocampal neuron-astrocyte co-cultures assessed by Western blotting. A, Immunodetection of GAD 65, GAD 67, and βIII-tubulin in Western blots with protein lysates derived from neurons co-cultured with astrocytes for 14 and 21 DIV. B, Quantifications of the GAD 65 and 67 expressions were normalized to βIII-tubulin bands. C, Immunodetection of vGlut and βIII-tubulin after 14 and 21 DIV in the same culture. Quantification of the relative vGlut expression is shown in D. Different genotypes are indicated as A (the astrocyte genotype) or N (the neuron genotype). Data represent means ± SEM and were considered significantly different at p ≤ 0.05 using ANOVA and Scheffe post hoc test. 14 DIV: n = 7; 21 DIV: n = 3.
Figure 4.
Figure 4.
Synaptic puncta expression in primary hippocampal neuron-astrocyte co-cultures of different genotype combinations. Immunocytochemical stainings of primary hippocampal neurons were performed with antibodies against Bassoon and PSD 95. Neurons were grown for 14 DIV (A) and 21 DIV (C) in the four different neuron-astrocyte combinations as indicated (A indicates astrocyte genotype; N, neuron genotype). Areas of higher magnifications are indicated in the red boxes and are shown in adjacent images. Scale bar, 20 μm. Quantification of the punctate staining (red puncta: bassoon; green puncta: PSD 95; yellow puncta: colocalization of both) after 14 DIV (B) and 21 DIV (D). Data represent mean values ± SEM of percent decrease and percent increase compared with the control situation (Aw/w|Nw/w). For the bar graphs, 40 individual neurons were assessed per combination: 160 neurons (n) per given time point and 3 independent experiments (N) were analyzed (N = 3, n = 960). Because three categories of puncta were measured and the percent increment was calculated for each individual puncta number, the graphs are based on 2880 calculated percent-values. Data were considered significantly different at p ≤ 0.05 using ANOVA and the Scheffe post hoc test. The significance levels are indicated as follows: *p ≤ 0.05, **p ≤ 0.01, ***p ≤ 0.001.
Figure 5.
Figure 5.
PNN formation in vitro. Detection of PNNs accumulated around βIII-tubulin-positive neurons after 14 DIV (A) and 21 DIV (B) via WFA binding. Primary hippocampal neurons from different genotypes were co-cultured with respective astrocytes as indicated (A indicates the astrocyte genotype; N, the neuron genotype). Scale bar, 50 μm. The percentage of PNN-bearing neurons was quantified in three independent experiments and is shown in C (N = 3, n = 1200). The size of the nets was quantified via respective pixel counting and is shown in D (N = 3). Data were considered significantly different at p ≤ 0.05 using ANOVA and the Scheffe post hoc test. The significance levels are indicated as follows: *p ≤ 0.05, **p ≤ 0.01, ***p ≤ 0.001. Error bars indicate ± SEM. The Aw/w|Nko/ko and Ako/ko|Nko/ko combinations were indistinguishable in statistical analysis. Not all horizontal bars are included for the sake of clarity of the graph.
Figure 6.
Figure 6.
Synapse formation on PNN-coated neurons. Immunocytochemical detection of Bassoon, PSD 95, and PNNs (via WFA binding) in cultures of primary hippocampal neurons is shown. A, Triple staining of Bassoon, PSD95, and WFA showing synaptic puncta emerging in the gaps between WFA-positive areas. The correlation is precise and adjacent expression is underlined by the color profile of an exemplary neurite, shown in B. C, D, Triple staining of primary hippocampal neurons of different genotypes (N) grown in indirect co-culture with respective astrocytes (A) after 14 DIV (C) and 21 DIV (D). Higher magnifications from exemplary neurites are shown in smaller images and the area is outlined in white boxes. Scale bar, 10 μm. E, Quantification of the change in synaptic puncta expression compared with controls (Aw/w|Nw/w) after 14 DIV and after 21 DIV (F). Data are represented as mean values ± SEM and were considered significantly different at p ≤ 0.05 using ANOVA and the Scheffe post hoc test. For the bar graphs, 20 individual PNN-wearing neurons were assessed per combination: 80 neurons (n) per given time point and 3 independent experiments (N) were analyzed (N = 3, n = 480). The three categories of puncta were measured and the percent increment was calculated for each individual puncta number. Therefore, the graphs are based on 1440 calculated percent-values. Data were considered significantly different at p ≤ 0.05 using ANOVA and the Scheffe post hoc test. The significance levels are indicated as follows: *p ≤ 0.05, **p ≤ 0.01, ***p ≤ 0.001. The Aw/w|Nw/w and Ako/ko|Nw/w combinations were interchangeable in the statistical analysis. Not all horizontal bars are included to enhance the clarity of the graph.

References

    1. Asher RA, Morgenstern DA, Fidler PS, Adcock KH, Oohira A, Braistead JE, Levine JM, Margolis RU, Rogers JH, Fawcett JW. Neurocan is upregulated in injured brain and in cytokine-treated astrocytes. J Neurosci. 2000;20:2427–2438. - PMC - PubMed
    1. Balmer TS, Carels VM, Frisch JL, Nick TA. Modulation of perineuronal nets and parvalbumin with developmental song learning. J Neurosci. 2009;29:12878–12885. doi: 10.1523/JNEUROSCI.2974-09.2009. - DOI - PMC - PubMed
    1. Bartsch S, Bartsch U, Dörries U, Faissner A, Weller A, Ekblom P, Schachner M. Expression of tenascin in the developing and adult cerebellar cortex. J Neurosci. 1992;12:736–749. - PMC - PubMed
    1. Beattie EC, Stellwagen D, Morishita W, Bresnahan JC, Ha BK, Von Zastrow M, Beattie MS, Malenka RC. Control of synaptic strength by glial TNFalpha. Science. 2002;295:2282–2285. doi: 10.1126/science.1067859. - DOI - PubMed
    1. Brakebusch C, Seidenbecher CI, Asztely F, Rauch U, Matthies H, Meyer H, Krug M, Böckers TM, Zhou X, Kreutz MR, Montag D, Gundelfinger ED, Fässler R. Brevican-deficient mice display impaired hippocampal CA1 long-term potentiation but show no obvious deficits in learning and memory. Mol Cell Biol. 2002;22:7417–7427. doi: 10.1128/MCB.22.21.7417-7427.2002. - DOI - PMC - PubMed

Publication types

MeSH terms

LinkOut - more resources