. 2013 May 1;33(18):7825-36.
doi: 10.1523/JNEUROSCI.5583-12.2013.

Hypofunction of glutamatergic neurotransmission in the periaqueductal gray contributes to nerve-injury-induced neuropathic pain

Affiliations

Hypofunction of glutamatergic neurotransmission in the periaqueductal gray contributes to nerve-injury-induced neuropathic pain

Yu-Cheng Ho et al. J Neurosci. .

Abstract

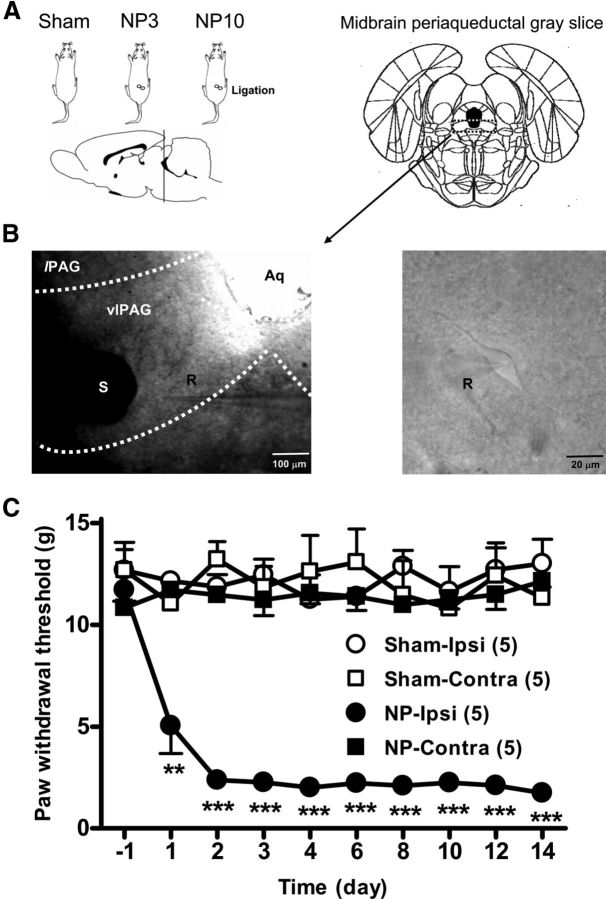
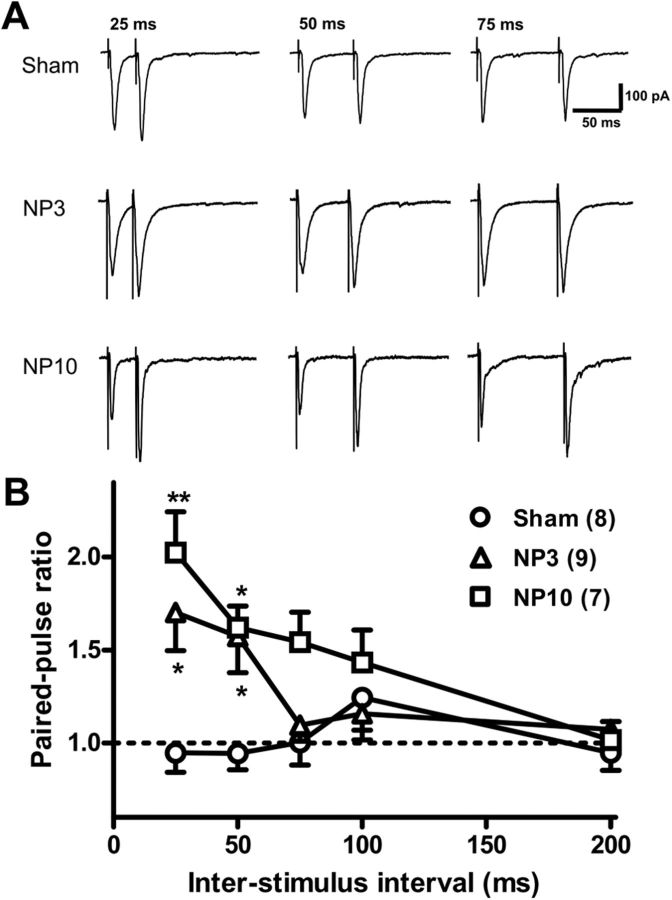
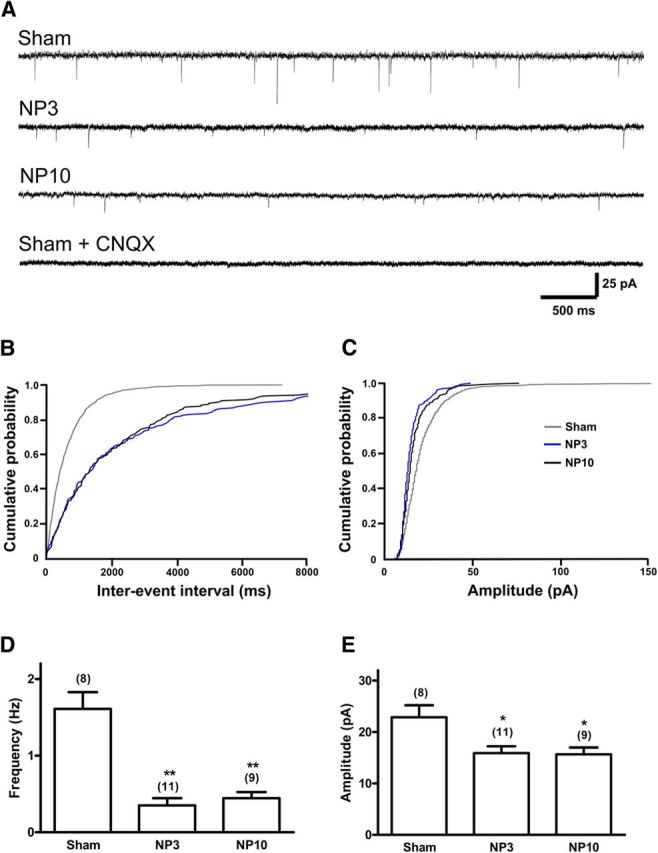
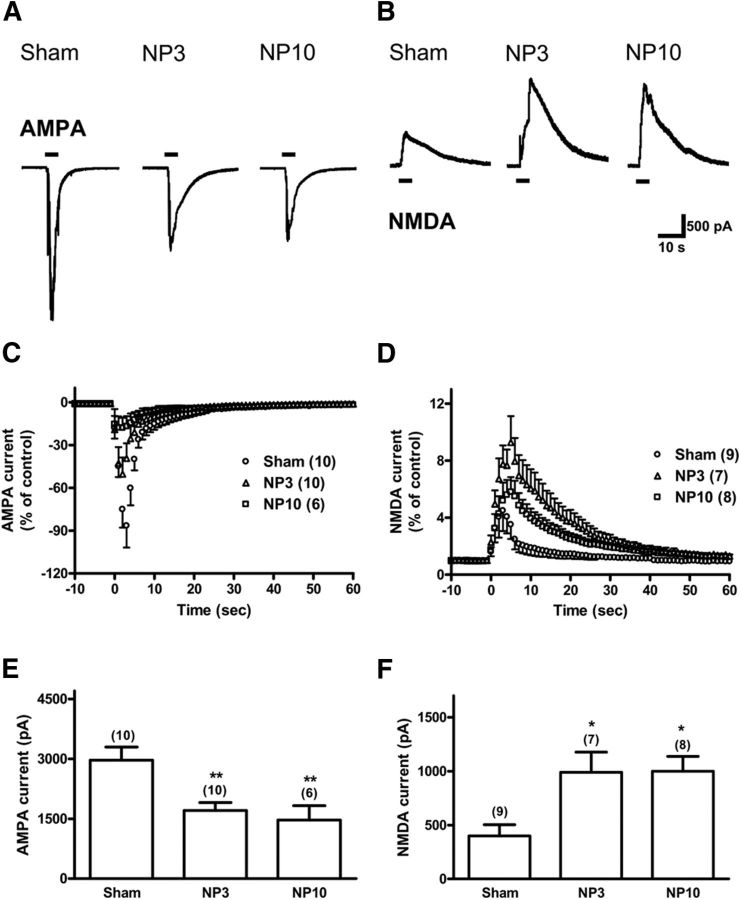
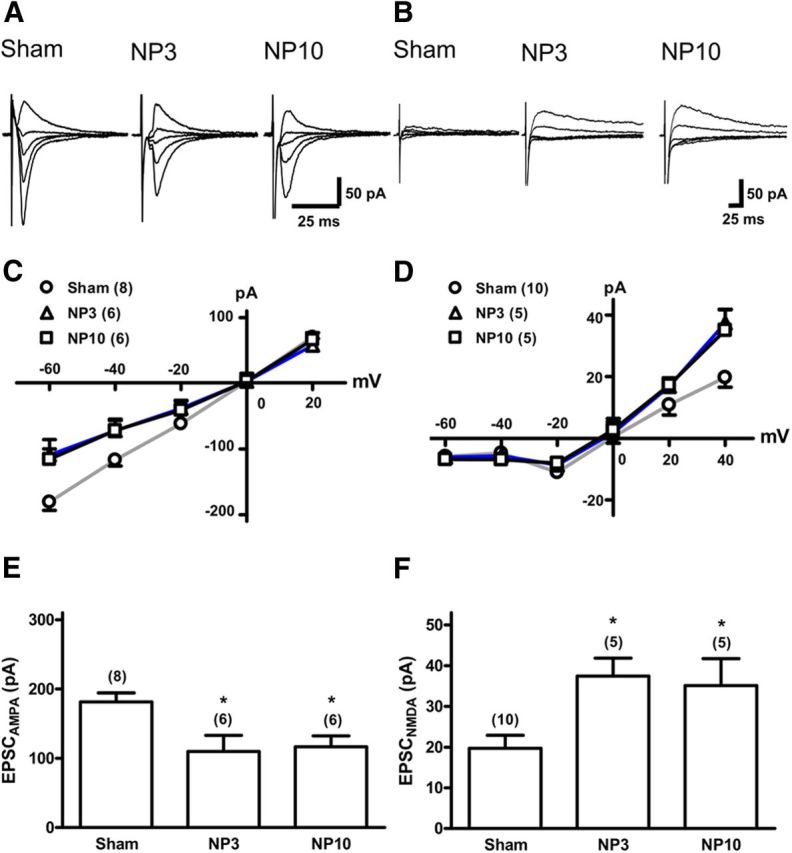
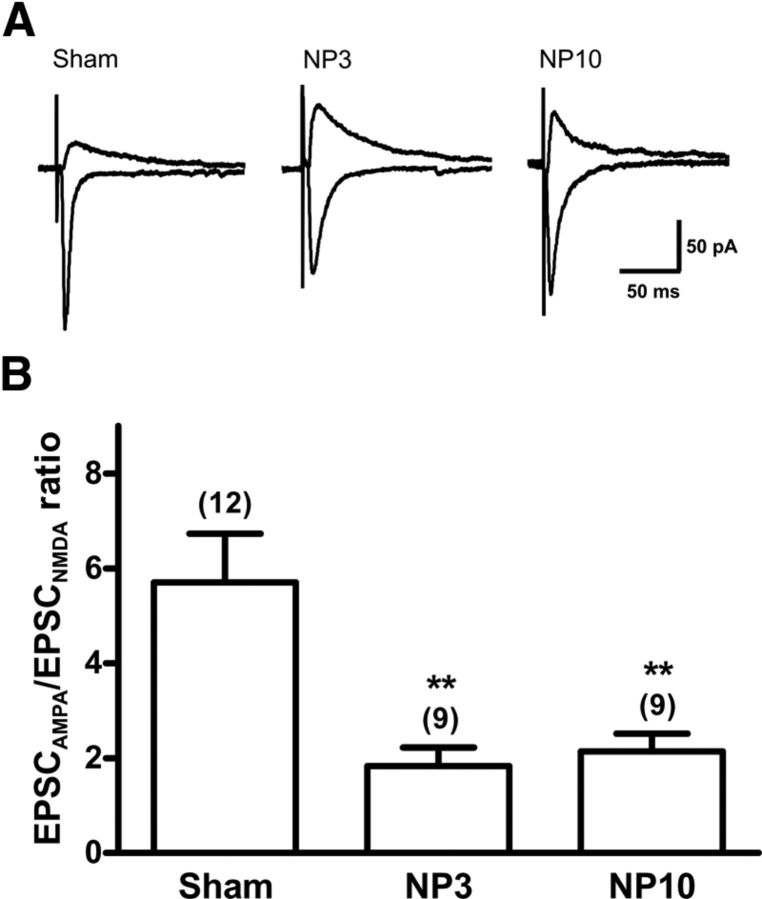
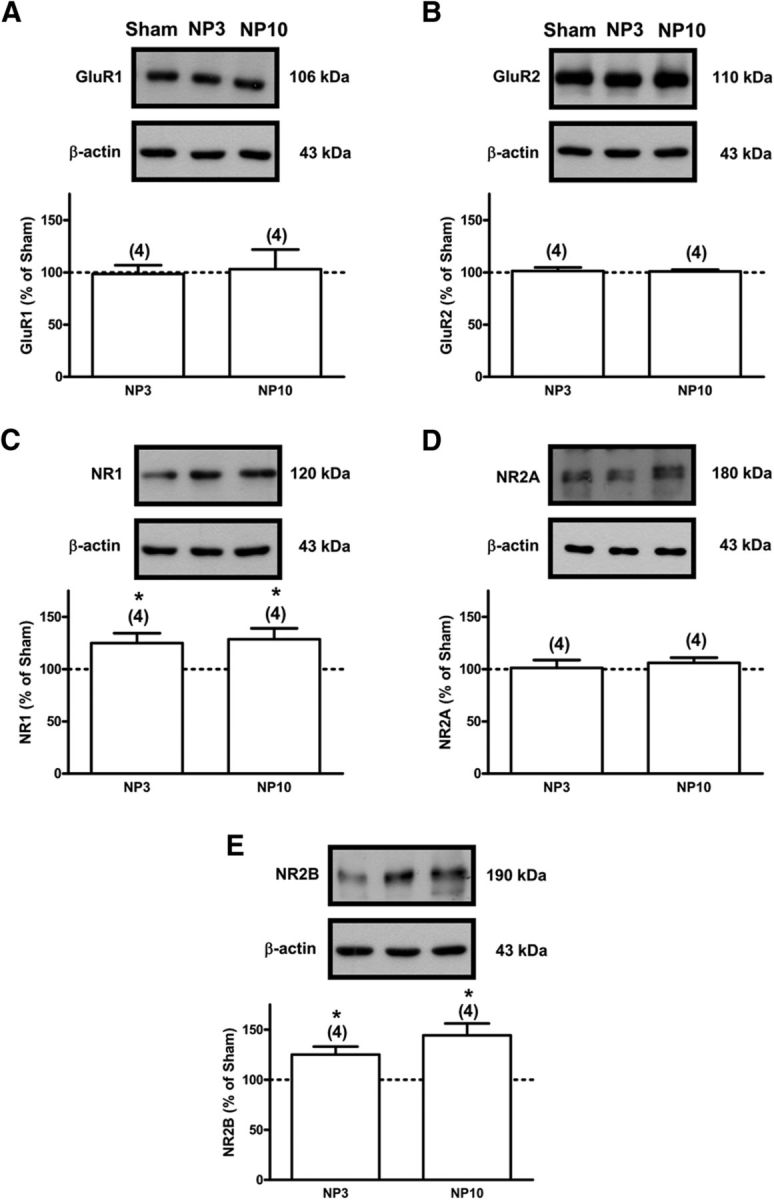
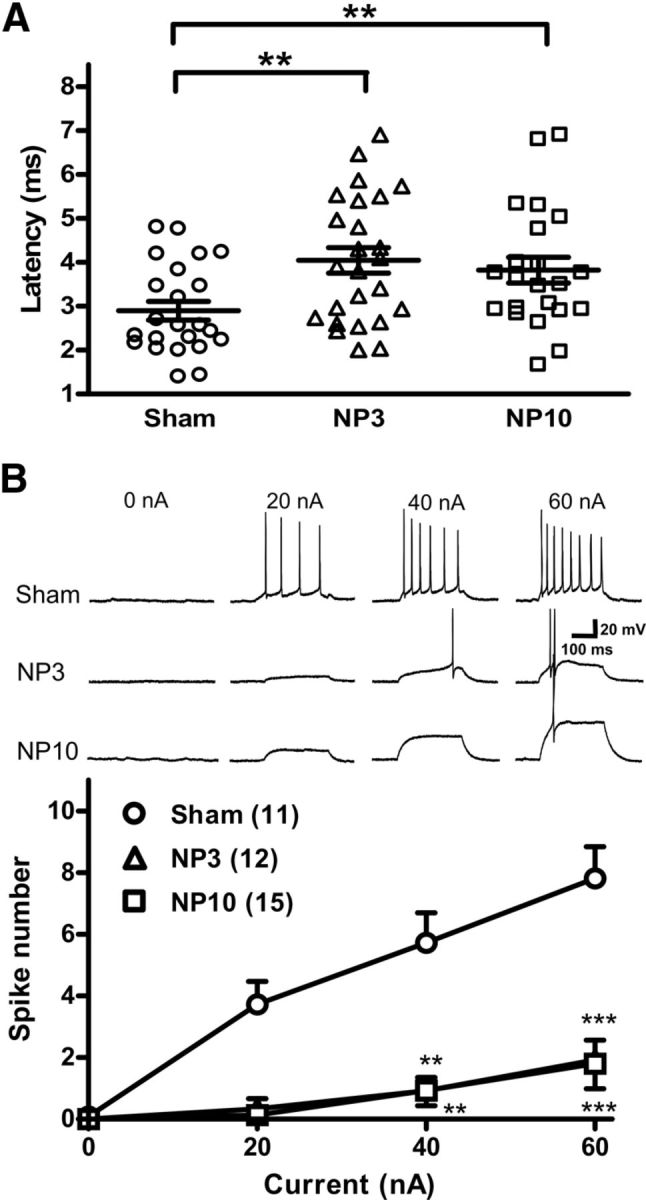
Neuropathic pain, a chronic pain due to neuronal lesion, remains unaltered even after the injury-induced spinal afferent discharges have declined, suggesting an involvement of supraspinal dysfunction. The midbrain ventrolateral periaqueductal gray (vlPAG) is known to be a crucial supraspinal region for initiating descending pain inhibition, but its role in neuropathic pain remains unclear. Therefore, here we examined neuroplastic changes in the vlPAG of midbrain slices isolated from neuropathic rats induced by L5/L6 spinal nerve ligation (SNL) via electrophysiological and neurochemical approaches. Significant mechanical hypersensitivity was induced in rats 2 d after SNL and lasted for >14 d. Compared with the sham-operated group, vlPAG slices from neuropathic rats 3 and 10 days after SNL displayed smaller EPSCs with prolonged latency, less frequent and smaller miniature EPSCs, higher paired-pulse ratio of EPSCs, smaller AMPAR-mediated EPSCs, smaller AMPA currents, greater NMDAR-mediated EPSCs, greater NMDA currents, lower AMPAR-mediated/NMDAR-mediated ratios, and upregulation of the NR1 and NR2B subunits, but not the NR2A, GluR1, or GluR2 subunits, of glutamate receptors. There were no significant differences between day 3 and day 10 neuropathic groups. These results suggest that SNL leads to hypoglutamatergic neurotransmission in the vlPAG resulting from both presynaptic and postsynaptic mechanisms. Upregulation of NMDARs might contribute to hypofunction of AMPARs via subcellular redistribution. Long-term hypoglutamatergic function in the vlPAG may lead to persistent reduction of descending pain inhibition, resulting in chronic neuropathic pain.


Figures

Figure 1.
Figure 1.
Schema demonstrating the locations of stimulating and recording electrodes in a vlPAG slice dissected from a neuropathic rat induced by L5/L6 SNL. A, Coronal midbrain slice containing the vlPAG dissected from a sham-operated rat and from an NP3 or NP10 rat. B, Left: Photomicrograph of a representative coronal midbrain slice where the vlPAG region, the area between two white dotted lines, was selected for conducting electrophysiological recordings. The stimulation electrode (S) was placed 50–200 μm away from the recording electrode. lPAG indicates lateral PAG; Aq, central aqueduct. Right: Higher-power image demonstrating a vlPAG neuron visualized under an IR-DIC microscope, where the whole-cell recording was conducted with a glass recording microelectrode (R). C, Development of mechanical hypersensitivity in rats receiving L5/L6 SNL. The ordinate is the paw withdrawal threshold to von Frey filament stimulation, expressed as gram force, and recorded as described in Materials and Methods. Note that mechanical hypersensitivity occurred within 2 d after SNL and lasted for 2 weeks in the ipsilateral (●), but not the contralateral (■), hindpaw to the injured side. The sample size (n) is denoted in parentheses for all figures. Two-way ANOVA with repeated measures over time analysis indicated significant differences with a main effect of group (F(3,144) = 171.5; p < 0.001) and time (F(9,144) = 4.329; p < 0.001) and in the interaction of group by time (F(27,144) = 3.769; p < 0.001). **p < 0.01, ***p < 0.001 compared with the sham group (post hoc Bonferroni's comparisons of the data points denoted).
Figure 2.
Figure 2.
SNL led to low efficiency of I-O transfer of glutamatergic transmission in vlPAG slices. A, I-O relationship of glutamatergic transmission established by the stimulation intensity (synaptic input) and the amplitude of EPSC (output) in slices isolated from sham-operated (Sham), NP3, and NP10 rats. Representative EPSCs evoked by 10, 20, 30, 40, and 50 V, respectively, were recorded in a vlPAG neuron of a slice isolated from the sham, NP3, or NP10 group. B, Averaged I-O curves of glutamatergic transmission in sham, NP3 and NP10 groups. The I-O curve was constructed by the percentage increment of the EPSC evoked at each stimulation intensity in each neuron, taking the EPSC evoked by 10 V as 100%. Note that the slope of the I-O curve in NP3 (▵) and NP10 (□) groups was significantly smaller than that in the sham group (○). Two-way ANOVA with repeated measures over intensity analysis indicated significant differences with a main effect of group (F(2,72) = 20.43; p < 0.001) and intensity (F(4,72) = 42.93; p < 0.001) and in the interaction of group by intensity (F(8,72) = 7.986; p < 0.001). **p < 0.01, ***p < 0.001 compared with the sham group (post hoc Bonferroni's comparisons of the data points denoted). n in the parentheses are the number of tested neurons in all the figures with electrophysiological experiments. Usually, 1 neuron was recorded from 1 slice and 1–2 slices were sampled from a sham-operated rat, whereas 1–2 neurons were successfully recorded from 4–5 slices isolated from an NP rat.
Figure 3.
Figure 3.
SNL led to reduced presynaptic glutamate release, revealed by increased PPR of EPSCs, in vlPAG slices. Paired EPSCs were evoked by paired pulses with intervals of 25, 50, 75, 100, and 200 ms. PPR was measured by the amplitude ratio of the second EPSC to the first one. A, Representative paired EPSCs evoked by 25, 50, and 75 ms-separated paired pulses in sham, NP3, and NP10 groups. B, PPR evoked at various intervals in the sham (○), NP3 (▵), and NP10 (□) groups. Two-way ANOVA with repeated measures over interstimulus interval analysis indicated significant differences with a main effect of group (F(2,84) = 11.25; p < 0.001) and interstimulus interval (F(4,84) = 6.054; p < 0.001) and in the interaction of group by interstimulus interval (F(8,84) = 2.799; p < 0.01). One-way ANOVA analysis indicated significant differences at 25 and 50 ms intervals in the NP groups compared with the sham group (25 ms interval, F(2,21) = 8.682, one-way ANOVA, p < 0.01, post hoc Dunnett's test; 50 ms interval, F(2,21) = 6.438, one-way ANOVA, p < 0.01, post hoc Dunnett's test) *p < 0.05, **p < 0.01 compared with the sham group.
Figure 4.
Figure 4.
SNL led to less frequent and smaller miniature EPSCs in vlPAG slices. mEPSCs were recorded at −70 mV in the presence of 1 μm TTX and 10 μm bicuculline. A, Representative trace of mEPSCs recorded in a vlPAG slice isolated from a sham, NP3, or NP10 rat or a rat from the sham group treated with 20 μm CNQX. B, C, Cumulative probability histograms of the interevent interval (B) or amplitude (C) of mEPSCs in the three groups. Note that the interevent interval of mEPSCs (B) was significantly longer and the amplitude (C) was smaller in NP3 and NP10 groups than in the sham group (p < 0.01, Kolmogorov–Smirnov test). D, E, Bar charts of averaged frequency, (F(2,25) = 26.23, one-way ANOVA, p < 0.001; D), and amplitude, (F(2,25) = 5.647, one-way ANOVA, p < 0.01; E) of mEPSCs in the sham, NP3, and NP10 groups. *p < 0.05, **p < 0.01 compared with the sham group (post hoc Dunnett's test).
Figure 5.
Figure 5.
SNL resulted in smaller AMPA currents and greater NMDA currents in vlPAG slices. AMPA and NMDA currents were induced by puff application (8 psi) of AMPA (1 μm) and NMDA (10 μm) for 5 s, respectively, onto the recorded neurons. AMPA currents were recorded at −70 mV in the presence of 10 μm bicuculline and 50 μm APV. NMDA currents were recorded at +40 mV with 20 μm CNQX and 10 μm bicuculline. A, B, Representative AMPA (A) and NMDA (B) currents induced by AMPA and NMDA (horizontal bars), respectively, were recorded in vlPAG slices isolated from sham, NP3, and NP10 groups. C, D, Normalized AMPA (C) and NMDA (D) currents recorded in the sham (○), NP3 (▵), and NP10 (□) groups. Normalized AMPA (C) and NMDA (D) currents were obtained by normalizing the currents recorded every 1 s during puff application of AMPA and NMDA in each neuron to the baseline current at −70 mV and +40 mV, respectively. E, F, Averaged AMPA (E) and NMDA (F) currents recorded from vlPAG slices taken from sham, NP3, and NP10 rats. Note that the AMPA current was significantly smaller (F(2,23) = 7.596, one-way ANOVA, p < 0.01; E) but the NMDA current was larger (F(2,21) = 6.296, one-way ANOVA, p < 0.01; F) in the NP groups compared with the sham group. *p < 0.05, **p < 0.01 compared with the sham group (post hoc Dunnett's test).
Figure 6.
Figure 6.
SNL resulted in reduced EPSCAMPAs and enhanced EPSCNMDAs in vlPAG slices. EPSCAMPAs were recorded with 50 μm APV (A) and EPSCNMDAs were recorded with 20 μm CNQX (B) in the presence of 10 μm bicuculline at −60, −40, −20, 0, +20, and +40 mV. The IV curves of EPSCAMPAs (C) and EPSCNMDAs (D) in sham (○; gray line), NP3 (▵; blue line), and NP10 (□; black line) groups. E, F, Averaged EPSCAMPAs recorded at −60 mV (E) and EPSCNMDAs at +40 mV (F) in the three groups. Note that the EPSCAMPA was significantly smaller (F(2,17) = 5.742, one-way ANOVA, p < 0.05) but the EPSCNMDA was larger (F(2,17) = 5.369, one-way ANOVA, p < 0.05) in the NP groups than in the sham group. *p < 0.05 compared with the sham group (post hoc Dunnett's test).
Figure 7.
Figure 7.
The ratio of EPSCAMPA/ EPSCNMDA recorded from the same neuron was significantly reduced in the vlPAG of rats after SNL. The EPSCAMPAs and EPSCNMDAs were recorded in the same neuron at −70 and +40 mV, respectively. A, Representative trace of EPSCAMPAs (downward) and EPSCNMDAs (upward) recorded from a vlPAG neuron of the slice dissected from the sham, NP3, and NP10 groups. B, Averaged ratio of EPSCAMPA/EPSCNMDA in the sham, NP3, and NP10 groups. The average of the ratio of EPSCAMPA/EPSCNMDA, which was calculated from each recorded neuron, in the NP groups was significantly lower than in the sham group (F(2,27) = 8.354, one-way ANOVA, p < 0.01). **p < 0.01 compared with the sham group (post hoc Dunnett's test).
Figure 8.
Figure 8.
SNL resulted in upregulation of the NR1 and NR2B subunits of NMDARs, but not the GluR1 or GluR2 subunit of AMPARs in the vlPAG. Representative Western blots and summarized bar graphs depicting the expression level of GluR1 (A), GluR2 (B), NR1 (C), NR2A (D), or NR2B (E) subunit protein in vlPAG samples micropunched from sham, NP3, and NP10 rats. The top blots are the immunoreactive bands against the respective antibody against the GluR1, GluR2, NR1, NR2A, or NR2B subunit protein and the bottom blots are the bands for the housekeeping protein β-actin. The ordinate of the base graph is the expression level of the receptor protein, taking the sham group as 100%. *p < 0.05 compared with the sham group as 100% (one-sample t test).
Figure 9.
Figure 9.
SNL resulted in a prolongation of the latency of EPSCs in vlPAG slices. A, Latency of the EPSC measured as the time difference between the stimulation artifact and the takeoff of EPSC in the sham (○), NP3 (▵), and NP10 (□) groups. Each data point represents the latency of one EPSC recorded in a neuron from the sham, NP3, and NP10 groups (F(2,67) = 5.137, one-way ANOVA, p < 0.01). **p < 0.01 compared with the sham group (post hoc Dunnett's test). B, Whole-cell current-clamp recordings of action potentials generated by current injection in vlPAG neuron of the sham, NP3, and NP10 groups. Top: Representative recordings of action potentials induced by a current of 0, 20, 40, and 60 nA for 200 ms in the sham, NP3, and NP10 groups. Bottom: Averaged spike number induced by current injection in vlPAG sham (○), NP3 (▵), and NP10 (□) groups. Two-way ANOVA with repeated measures over current analysis indicated significant differences with a main effect of group (F(2,105) = 20.11; p < 0.0001) and of current (F(3,105) = 47.14; p < 0.0001), and in the interaction of group by current (F(6,105) = 12.08; p < 0.0001). **p < 0.01, ***p < 0.001 compared with the sham group (post hoc Bonferroni's comparisons of the data points denoted).

Similar articles

Cited by

References

    1. Bagley EE, Gerke MB, Vaughan CW, Hack SP, Christie MJ. GABA transporter currents activated by protein kinase A excite midbrain neurons during opioid withdrawal. Neuron. 2005;45:433–445. doi: 10.1016/j.neuron.2004.12.049. - DOI - PubMed
    1. Basbaum AI, Fields HL. Endogenous pain control systems: brainstem spinal pathways and endorphin circuitry. Annu Rev Neurosci. 1984;7:309–338. doi: 10.1146/annurev.ne.07.030184.001521. - DOI - PubMed
    1. Beattie EC, Carroll RC, Yu X, Morishita W, Yasuda H, von Zastrow M, Malenka RC. Regulation of AMPA receptor endocytosis by a signaling mechanism shared with LTD. Nat Neurosci. 2000;3:1291–1300. doi: 10.1038/81823. - DOI - PubMed
    1. Bredt DS, Nicoll RA. AMPA receptor trafficking at excitatory synapses. Neuron. 2003;40:361–379. doi: 10.1016/S0896-6273(03)00640-8. - DOI - PubMed
    1. Burgess SE, Gardell LR, Ossipov MH, Malan TP, Jr, Vanderah TW, Lai J, Porreca F. Time-dependent descending facilitation from the rostral ventromedial medulla maintains, but does not initiate, neuropathic pain. J Neurosci. 2002;22:5129–5136. - PMC - PubMed

Publication types

MeSH terms

LinkOut - more resources