. 2013 May 1;33(18):7941-51.
doi: 10.1523/JNEUROSCI.5001-12.2013.

Phosducin-like protein 1 is essential for G-protein assembly and signaling in retinal rod photoreceptors

Affiliations

Phosducin-like protein 1 is essential for G-protein assembly and signaling in retinal rod photoreceptors

Chun Wan J Lai et al. J Neurosci. .

Abstract

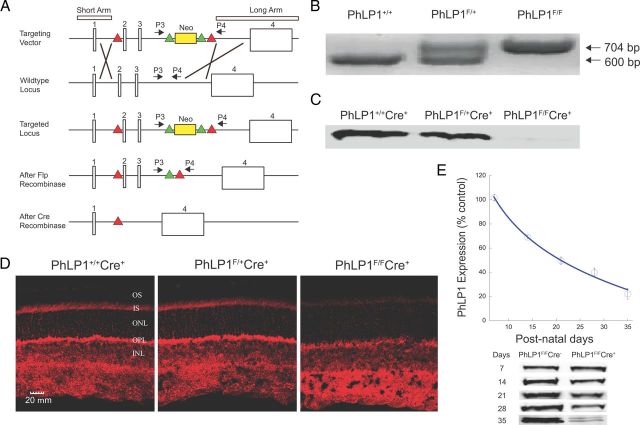
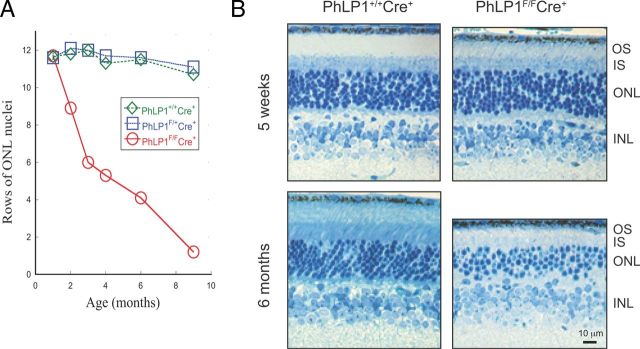
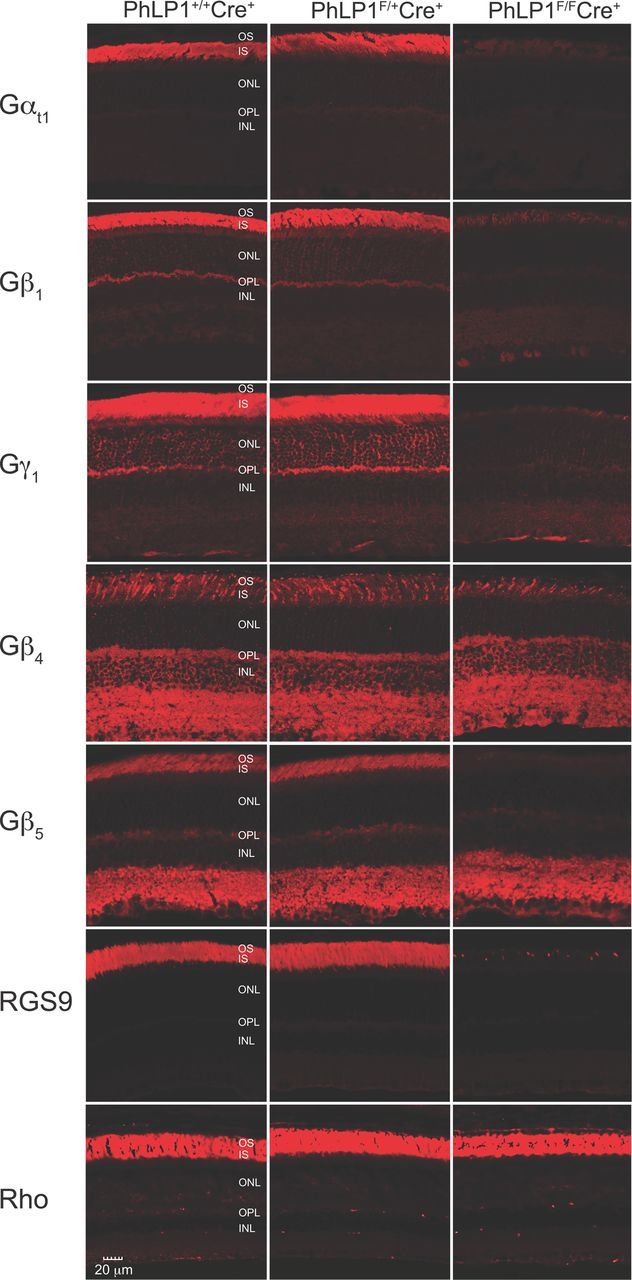
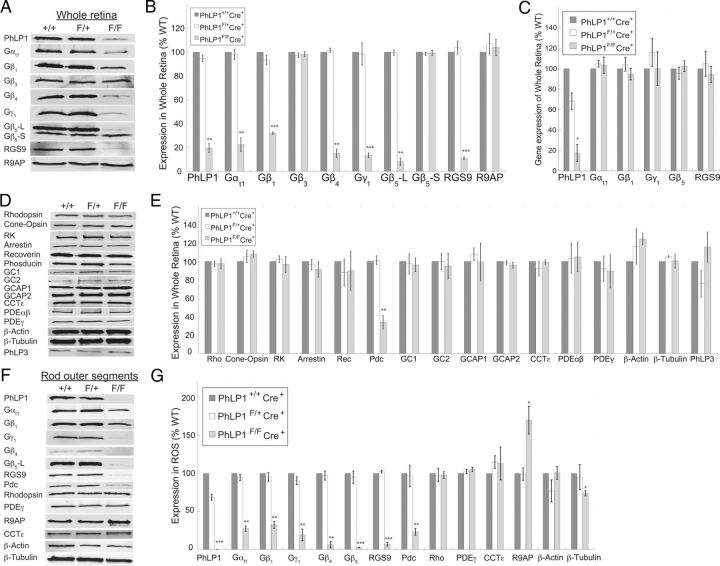
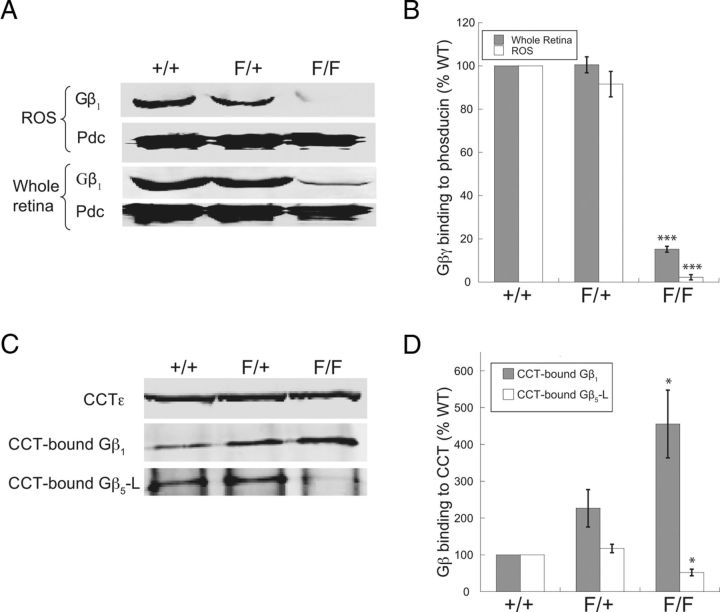
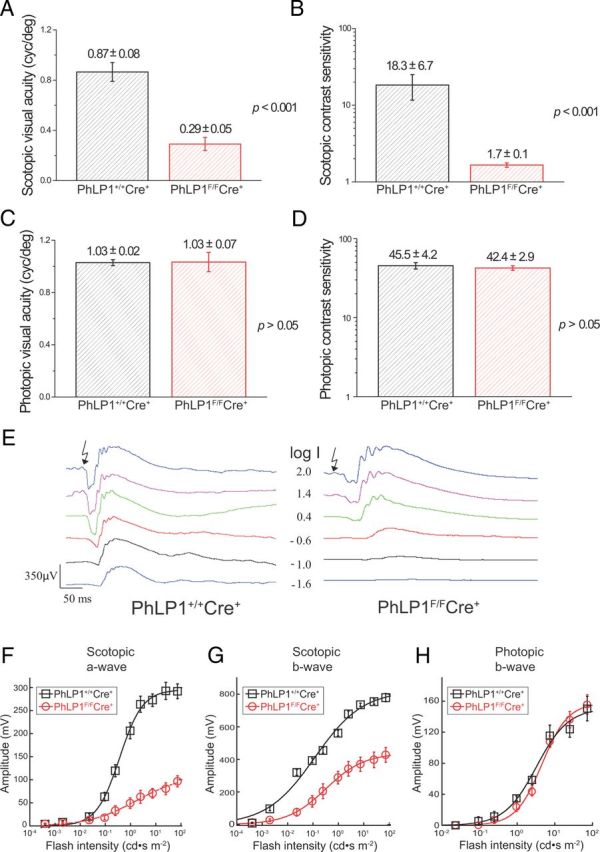
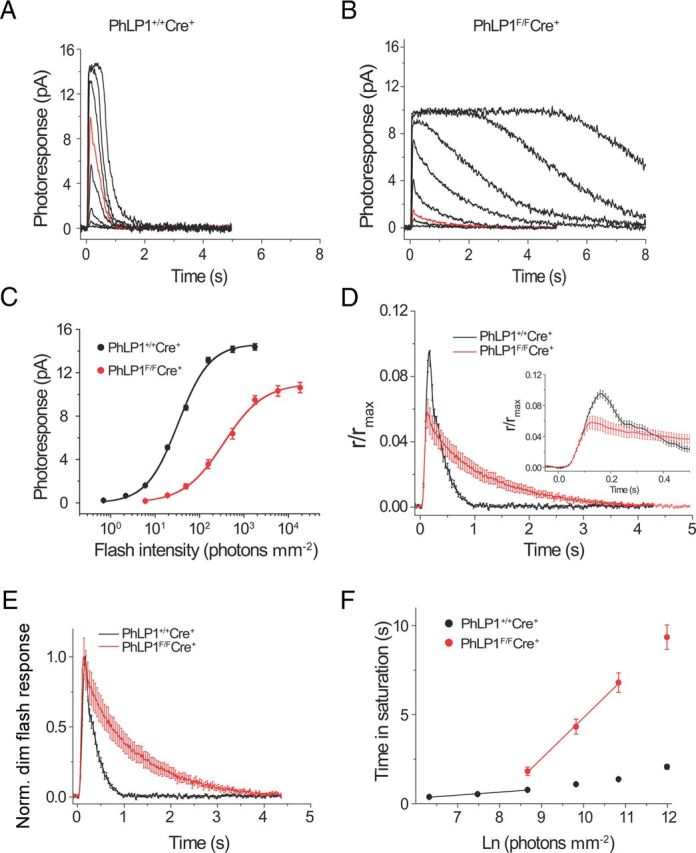
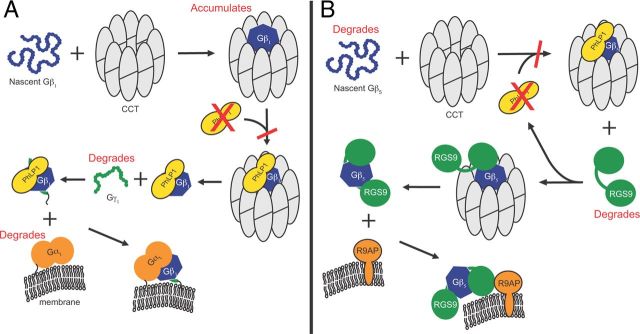
G-protein β subunits perform essential neuronal functions as part of G-protein βγ and Gβ5-regulators of G-protein signaling (RGS) complexes. Both Gβγ and Gβ5-RGS are obligate dimers that are thought to require the assistance of the cytosolic chaperonin CCT and a cochaperone, phosducin-like protein 1 (PhLP1) for dimer formation. To test this hypothesis in vivo, we deleted the Phlp1 gene in mouse (Mus musculus) retinal rod photoreceptor cells and measured the effects on G-protein biogenesis and visual signal transduction. In the PhLP1-depleted rods, Gβγ dimer formation was decreased 50-fold, resulting in a >10-fold decrease in light sensitivity. Moreover, a 20-fold reduction in Gβ5 and RGS9-1 expression was also observed, causing a 15-fold delay in the shutoff of light responses. These findings conclusively demonstrate in vivo that PhLP1 is required for the folding and assembly of both Gβγ and Gβ5-RGS9.


Figures

Figure 1.
Figure 1.
Generation and characterization of the rod photoreceptor-specific PhLP1 knock-out mouse. A, The scheme for constructing the floxed Phlp1 gene is shown. Sketch 1 shows the targeting vector with the short and long homology arm regions, the neomycin selection cassette flanked by frt recombination sites (green triangles) placed in intron 3 and the loxP recombination sites in introns 1 and 3 (red triangles). Crossover lines indicate the regions of homologous recombination. Sketch 2 shows the structure of the wild-type Phlp1 locus. Sketch 3 shows the targeted Phlp1 locus after recombination. Sketch 4 shows the floxed Phlp1 gene after removal of the neomycin cassette by FLP recombination. Sketch 5 shows the disrupted gene after Cre recombination. P3 and P4 represent the forward and reverse primer sites used for genotyping the flox-Phlp1 mice. B, PCR genotyping results using the P3 and P4 primers. The flox-Phlp1 gene produced a 704 bp product, while the wild-type phlp1 gene produced a 600 bp product. C, Immunoblot detection of PhLP1 in rod outer segment preparations from 1-month-old PhLP1+/+Cre+, PhLP1F/+Cre+, and PhLP1F/FCre+ mice. D, Immunolocalization of PhLP1 in retinal cross-sections from 1-month-old PhLP1+/+Cre+, PhLP1F/+Cre+, and PhLP1F/FCre+ mice. E, Time course of Cre-mediated loss of PhLP1 expression. Retinal extracts from PhLP1F/FCre+ and PhLP1F/FCre mice were immunoblotted for PhLP1 at the indicated postnatal days. The PhLP1 bands were quantified and normalized relative to the PhLP1F/FCre control. Symbols represent the average ± SEM from three mice of each genotype. Representative immunoblots are shown below the graph.
Figure 2.
Figure 2.
Progressive photoreceptor degeneration in PhLP1-deficient rods. A, Age-dependent loss of photoreceptors in PhLP1F/FCre+ mice. The number of photoreceptors was measured by counting rows of DAPI-stained nuclei in the outer nuclear layer from mice at increasing ages. Data points at 1 month represent the average ± SEM from three mice of each genotype. (Error bars are smaller than the symbols.) Other data points are from single mice. B, Retinal morphology of PhLP1F/FCre+ compared to wild-type mice at 5 weeks and 6 months. Retinal sections were contrasted using Richardson's stain (methylene blue-azure II). OS, Outer segment; IS, inner segment; ONL, outer nuclear layer; INL, inner nuclear layer.
Figure 3.
Figure 3.
Immunolocalization of G-protein subunits in PhLP1-deficient rods. Retinal cross-sections from 1-month-old PhLP1+/+Cre+, PhLP1F/+Cre+, and PhLP1F/FCre+ mice were probed with primary antibodies to Gαt1, Gβ1, Gγ1, Gβ4, Gβ5, RGS9, and rhodopsin and detected with fluorescein-conjugated secondary antibodies.
Figure 4.
Figure 4.
Protein expression in PhLP1-deficient rods. A, Immunoblots of whole retinal extracts for PhLP1, various G-protein subunits, RGS9, and R9AP are shown for 1-month-old PhLP1+/+Cre+, PhLP1F/+Cre+, and PhLP1F/FCre+ mice. B, Quantification of the immunoblot bands in A relative to the wild type. C, Levels of the indicated mRNAs in whole retinal extracts were determined by quantitative RT-PCR. The primer for PhLP1 detection was in exon 2 so no RT-PCR product would be expected from the Cre-deleted gene. D, Immunoblots of other rod and cone proteins are shown for 1-month-old PhLP1+/+Cre+, PhLP1F/+Cre+, and PhLP1F/FCre+ mice. E, Quantification of the immunoblot bands in D relative to the wild type. F, Immunoblots of rod outer segment preparations from 1-month-old PhLP1+/+Cre+, PhLP1F/+Cre+, and PhLP1F/FCre+ mice are shown for the indicated proteins. G, Quantification of the immunoblot bands in F relative to the wild type. In all panels, bars represent the average ± SEM from three to five different preparations. *p < 0.05; **p < 0.01; ***p < 0.001.
Figure 5.
Figure 5.
Gβγ dimer determination in PhLP1-deficient rods. The amount of Gβγ dimers in whole retina or rod outer segment preparations from 1-month-old PhLP1+/+Cre+, PhLP1F/+Cre+, and PhLP1F/FCre+ mice was determined in a Pdc-binding assay. A, The amount of Gβγ in Pdc precipitates was measured by blotting for Gβ1. B, Quantification of the Gβ1 bands in A relative to the wild type. C, The amount of Gβ1 and Gβ5 associated with CCT in whole retinas was determined by coimmunoprecipitation. CCT complexes were immunoprecipitated with an antibody to CCTε, and Gβ1 and Gβ5 in the immunoprecipitate were determined by immunoblotting. D, Quantification of the Gβ1/CCTε and Gβ5/CCTε band ratios relative to the wild type. In all panels, bars represent the average ± SEM from three to five different preparations. *p < 0.05; ***p < 0.001.
Figure 6.
Figure 6.
Impairment of scotopic vision in PhLP1-deficient mice. Data were derived from mouse optomotor responses to rotating gratings under both scotopic (−4.45 log cd m−2) and photopic (1.85 log cd m−2) background illumination conditions. In contrast sensitivity measurements, Ft was fixed at its optimal value of 0.8 Hz for both conditions. A, Scotopic visual acuity. B, Scotopic contrast sensitivity. C, Photopic visual acuity. D, Photopic contrast sensitivity. All data are means ± SEM. E, Families of ERG responses from 1-month-old PhLP1+/+Cre+ and PhLP1F/FCre+ mice are shown. Light intensity values (I) are in log candela seconds per square meter. F, Intensity–response relationships for scotopic a-waves from PhLP1+/+Cre+ (n = 7) and PhLP1F/FCre+ (n = 12) mice. Data were fit to a hyperbolic Naka–Ruston function that yielded fit parameters shown in Table 1. G, Intensity–response relationships for scotopic b-waves. Data were fit as in F, and fit parameters are shown in Table 1. H, Intensity–response relationships for photopic b-waves from five mice are shown. Data were fit as in F.
Figure 7.
Figure 7.
Single-cell photoresponses of PhLP1-deficient rods. A, B, Representative families of flash responses from 1-month-old PhLP1+/+Cre+ (A) and PhLP1F/FCre+ (B) mice are shown. Test flashes of 500 nm light with intensities of 0.7, 2.2, 6.0, 19.0, 49.5, 157, 557, and 1764 photons μm−2 (for control rods) or 6.0, 19.0, 49.5, 157, 557, 1764, 5811, and 18415 photons μm−2 (for PhLP1F/FCre+ rods) were delivered at time 0. The red traces show responses to an identical light intensity (49.5 photons μm−2). C, Intensity–response functions for rods from PhLP1+/+Cre+ (n = 22) and PhLP1F/FCre+ (n = 23) mice. Symbols represent the average ± SEM. Data were fit with a hyperbolic Naka–Rushton function and fit parameters are shown in Table 2. D, Amplification of the phototransduction cascade in mouse rods. Population-averaged dim flash responses to light intensities of 49.5 photons μm−2 for PhLP1F/FCre+ rods and 6.0 photons μm−2 for wild-type rods were normalized to their corresponding maximum dark currents, rmax. Then the PhLP1F/FCre+ fractional response was scaled down by the factor of 2.2 to make its initial rising phase coincide with that of wild-type response. The light intensity corresponding to this scaled PhLP1F/FCre+ response was thus determined as 49.5/2.2 = 22.5 photons μm−2. The inset shows the rising phase of the responses on an extended time scale. E, Kinetics of the dim flash responses. Normalized population-averaged dim flash responses to light intensities of 6.0 photons μm−2 for PhLP1+/+Cre+ (n = 22) and 49.5 photons μm−2 for PhLP1F/FCre+ (n = 23), demonstrating the decelerated photoresponse inactivation in PhLP1-deficient rods. F, Determination of the dominant time constant of recovery (τD) from a series of supersaturating flashes. Linear fits throughout the data yielded τD values indicated in Table 2. Values are means ± SEM.
Figure 8.
Figure 8.
Effects of PhLP1 deletion on Gβγ and Gβ5-RGS9 assembly. A, B, The scheme summarizes the proposed mechanisms for G-protein heterotrimer (A) and Gβ5-RGS9-R9AP assembly (B) and the effects of PhLP1 deletion on the assembly process (shown in red).

References

    1. Betke KM, Wells CA, Hamm HE. GPCR mediated regulation of synaptic transmission. Prog Neurobiol. 2012;96:304–321. doi: 10.1016/j.pneurobio.2012.01.009. - DOI - PMC - PubMed
    1. Chen CK, Burns ME, He W, Wensel TG, Baylor DA, Simon MI. Slowed recovery of rod photoresponse in mice lacking the GTPase accelerating protein RGS9-1. Nature. 2000;403:557–560. doi: 10.1038/35000601. - DOI - PubMed
    1. Chen CK, Eversole-Cire P, Zhang H, Mancino V, Chen YJ, He W, Wensel TG, Simon MI. Instability of GGL domain-containing RGS proteins in mice lacking the G protein beta-subunit Gbeta5. Proc Natl Acad Sci U S A. 2003;100:6604–6609. doi: 10.1073/pnas.0631825100. - DOI - PMC - PubMed
    1. Chen CK, Woodruff ML, Chen FS, Chen Y, Cilluffo MC, Tranchina D, Fain GL. Modulation of mouse rod response decay by rhodopsin kinase and recoverin. J Neurosci. 2012;32:15998–16006. doi: 10.1523/JNEUROSCI.1639-12.2012. - DOI - PMC - PubMed
    1. Fung BK. Characterization of transducin from bovine retinal rod outer segments. J Biol Chem. 1983;258:10495–10502. - PubMed

Publication types

MeSH terms

LinkOut - more resources