. 2013 May 1;33(18):8068-78.
doi: 10.1523/JNEUROSCI.5351-12.2013.

cAMP-mediated stabilization of fusion pores in cultured rat pituitary lactotrophs

Affiliations

cAMP-mediated stabilization of fusion pores in cultured rat pituitary lactotrophs

Ana Isabel Calejo et al. J Neurosci. .

Abstract

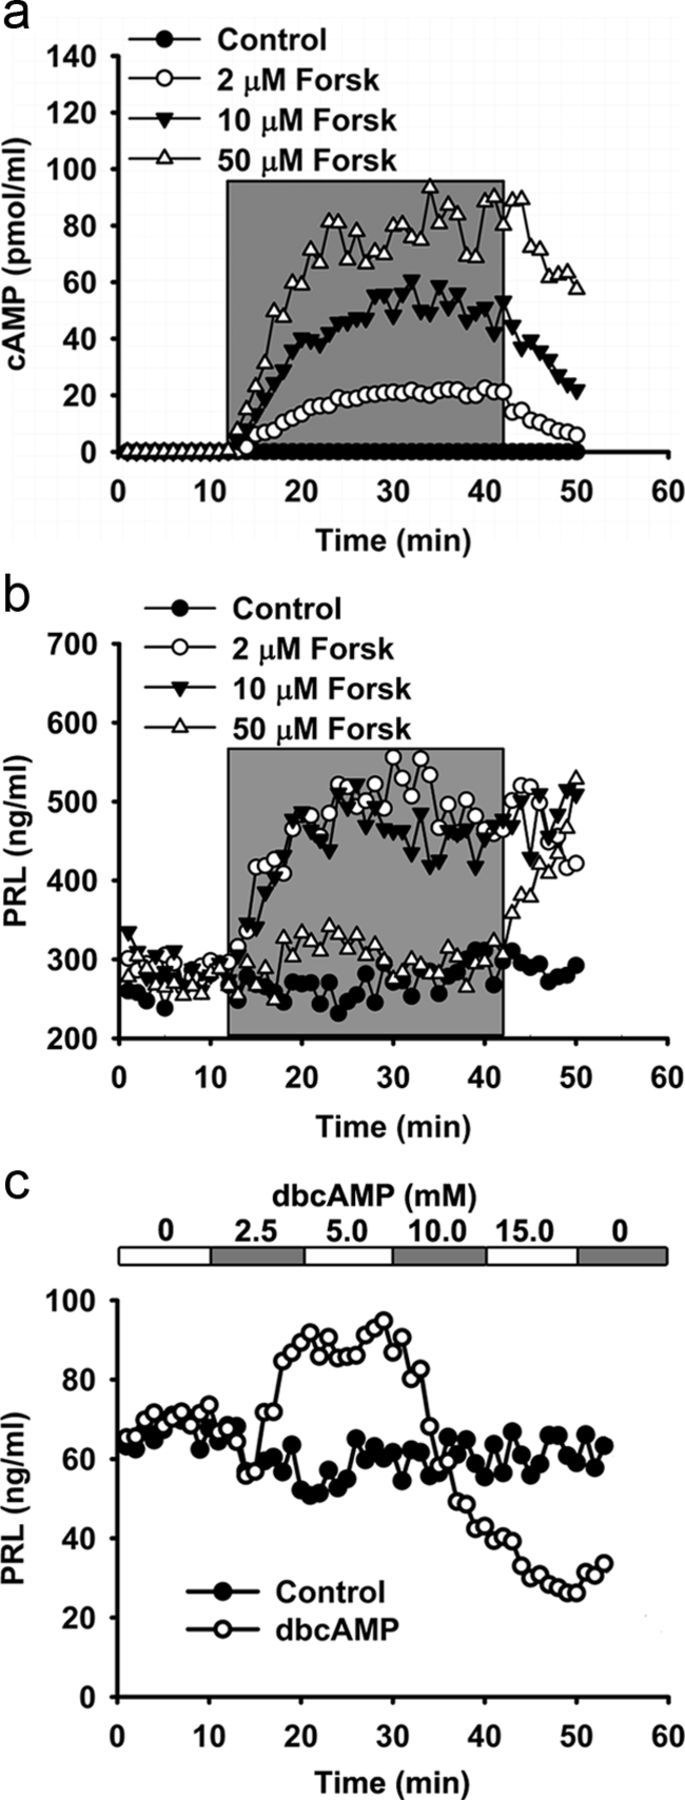
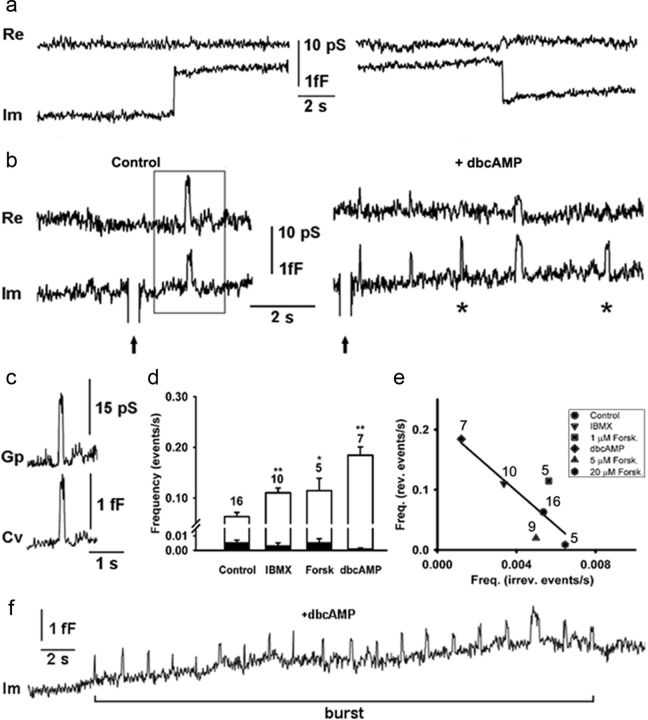
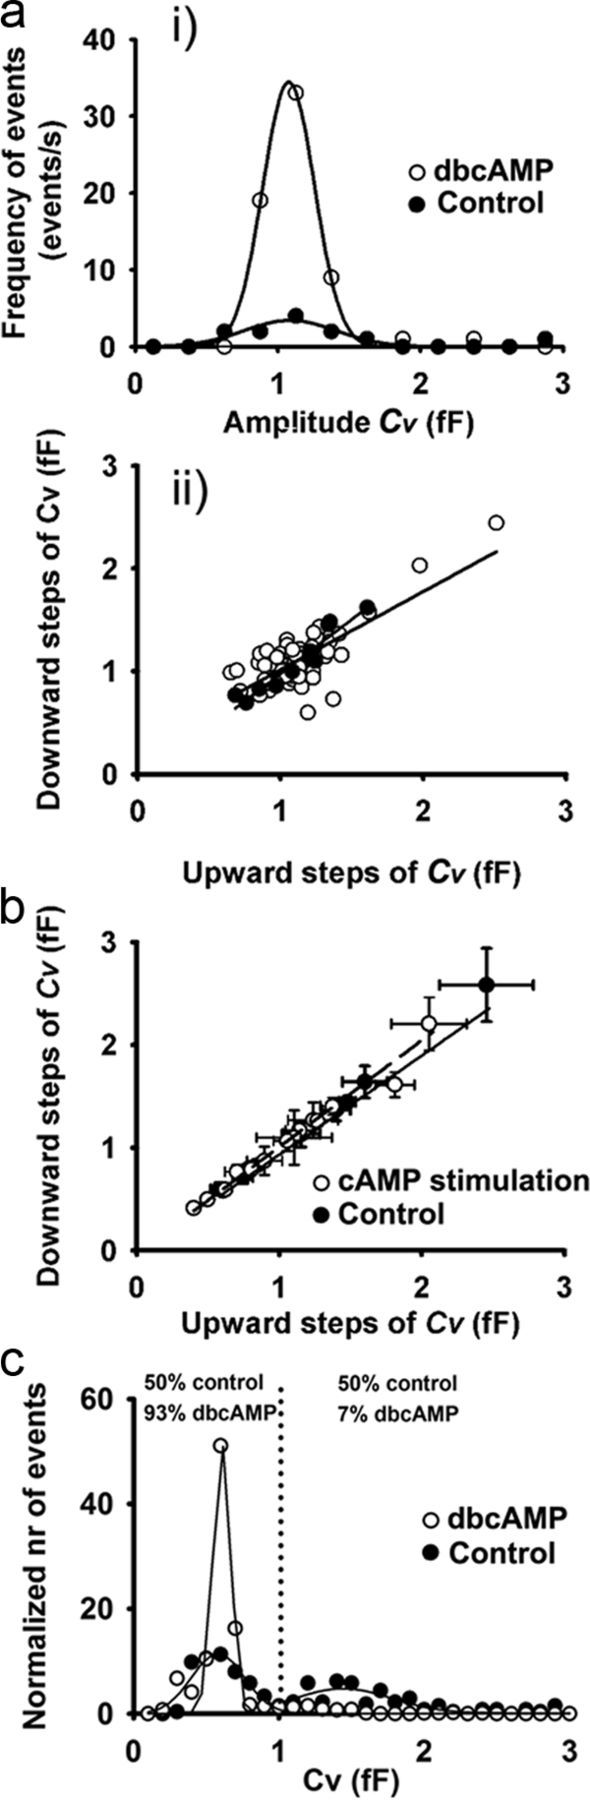
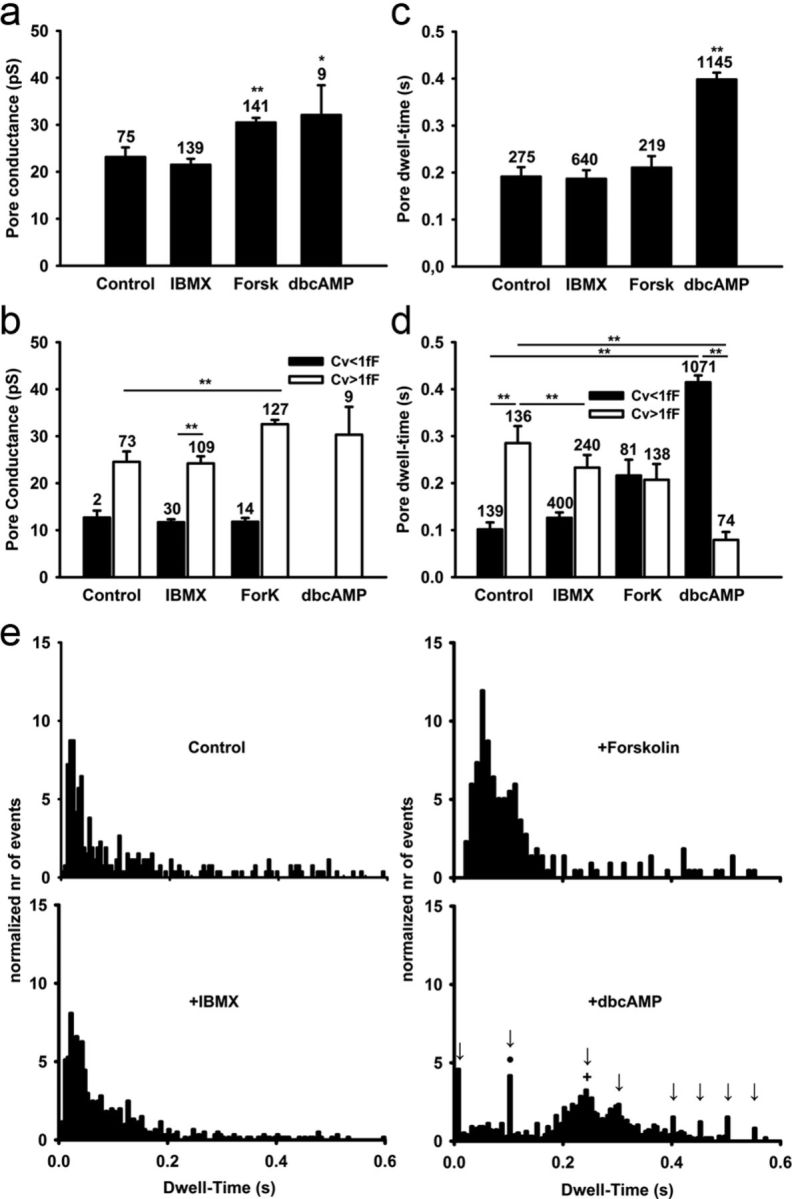
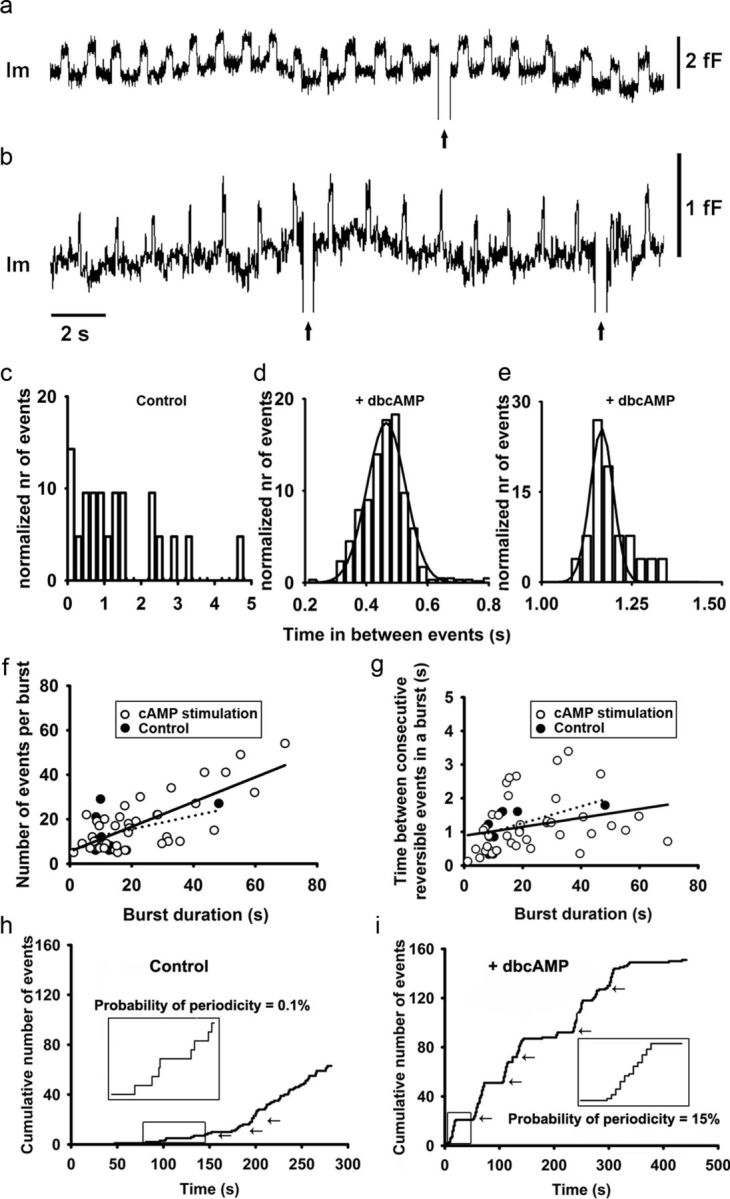
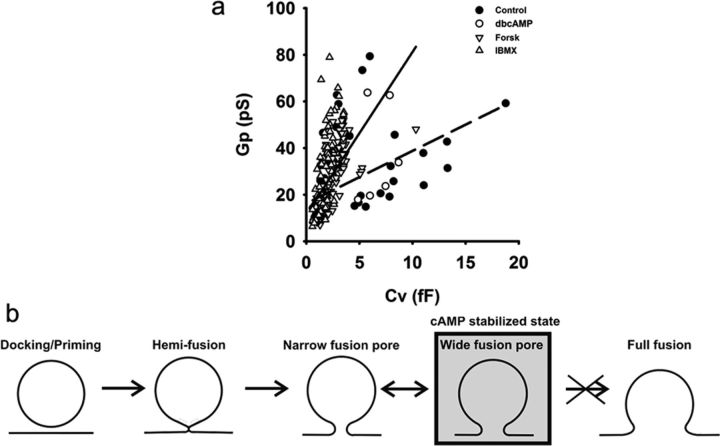
Regulated exocytosis mediates the release of hormones and transmitters. The last step of this process is represented by the merger between the vesicle and the plasma membranes, and the formation of a fusion pore. Once formed, the initially stable and narrow fusion pore may reversibly widen (transient exocytosis) or fully open (full-fusion exocytosis). Exocytosis is typically triggered by an elevation in cytosolic calcium activity. However, other second messengers, such as cAMP, have been reported to modulate secretion. The way in which cAMP influences the transitions between different fusion pore states remains unclear. Here, hormone release studies show that prolactin release from isolated rat lactotrophs stimulated by forskolin, an activator of adenylyl cyclases, and by membrane-permeable cAMP analog (dbcAMP), exhibit a biphasic concentration dependency. Although at lower concentrations (2-10 μm forskolin and 2.5-5 mm dbcAMP) these agents stimulate prolactin release, an inhibition is measured at higher concentrations (50 μm forskolin and 10-15 mm dbcAMP). By using high-resolution capacitance (Cm) measurements, we recorded discrete increases in Cm, which represent elementary exocytic events. An elevation of cAMP leaves the frequency of full-fusion events unchanged while increasing the frequency of transient events. These exhibited a wider fusion pore as measured by increased fusion pore conductance and a prolonged fusion pore dwell time. The probability of observing rhythmic reopening of transient fusion pores was elevated by dbcAMP. In conclusion, cAMP-mediated stabilization of wide fusion pores prevents vesicles from proceeding to the full-fusion stage of exocytosis, which hinders vesicle content discharge at high cAMP concentrations.


Figures

Figure 1.
Figure 1.
Elevation in cAMP cytosolic concentration increases PRL release from perfused pituitary lactotrophs. Cultured pituitary lactotrophs were perfused with extracellular solutions containing different concentrations of forskolin (Forsk), an adenyl cyclase activator, and dbcAMP. Samples were collected every minute and analyzed for either cAMP or PRL. a, Dose-dependent effect of forskolin on cAMP release in perfused lactotrophs. Gray represents the period of forskolin application. b, Dose-dependent effect of forskolin on PRL release from perfused lactotrophs. Gray represents the period of forskolin application. c, The effect of different concentrations of dbcAMP on the PRL release from perfused lactotrophs. The top x-axis represents the concentrations of applied dbcAMP. Shown are representative experiments from four independent experiments.
Figure 2.
Figure 2.
cAMP-increasing agents augment the frequency of reversible, but not the irreversible, discrete capacitance steps. The irreversible events are represented by discrete upward or downward step in the imaginary admittance trace (Im), which is proportional to the membrane capacitance. Reversible events consist of an upward and a subsequent downward discrete step in Im, which follows within 5 s. a, A representative example of irreversible upward (left) and downward steps (right) in Im trace and the corresponding real part of the admittance trace (Re, top). b, Reversible events in Im before (Control, left) and after the stimulation by dbcAMP (10 mm, +dbcAMP, right). Some of the reversible events in Im trace exhibit projections to the Re trace. *Others were devoid of projections. Arrows indicate calibration pulses in Im, used to adjust the phase of the lock-in amplifier. c, Projected reversible events were used to calculate Gp and Cv, as described in Materials and Methods. Shown is a representative example framed in b. d, The average frequency of irreversible upward events (filled bars) in controls was 0.005 ± 0.002 s (n = 16). The addition of phosphodiesterase inhibitor (IBMX, 1 mm), an agent to activate adenylyl cyclase (forskolin 1 μm, Forsk), and a membrane-permeable cAMP analog (dbcAMP, 10 mm) did not affect (p > 0.05) the frequency of irreversible upward events (0.003 ± 0.002, 0.006 ± 0.002, and 0.001 ± 0.001 s), respectively. The average frequency of reversible events (open bars) increased from 0.06 ± 0.01 s in controls to 0.11 ± 0.01 s (**p < 0.01; IBMX), 0.11 ± 0.02 s (*p < 0.05; forskolin), and 0.18 ± 0.02 s (**p < 0.01; dbcAMP). Values are mean ± SEM. Numbers above error bars indicate the number of patches. e, We observed negative relationships between the average frequency of irreversible upward events and the average frequency of reversible events for each condition, which was best fitted with the linear regression: y (the average frequency of reversible events) = (−21 ± 9) × x (the average frequency of irreversible upward events) + (0.20 ± 0.04) with the correlation coefficient, r = 0.85. f, Representative Im trace, showing a burst of reversible events. We defined a burst as a minimum of five reversible events with <5 s between ensuing reversible events.
Figure 3.
Figure 3.
Reversible events mirror repetitive fusion of single vesicle. ai, The distributions of vesicle membrane capacitance (Cv) amplitudes of reversible events from a representative patch, before and after the stimulation with dbcAMP, were similar. Lines show fitted Gaussian curves with means of 1.09 ± 0.05 fF (control, correlation coefficient r = 0.92; n = 11 events) and 1.08 ± 0.01 fF (dbcAMP, r = 0.99; n = 64 events), respectively. aii, The relationship between amplitudes of the downward and the preceding upward Cv steps of reversible events: the regression line represents the best fit with parameters: y (Cv amplitude of the downward step) = (1.0 ± 0.1) × x (Cv amplitude of the upward step) + (−0.1 ± 0.1) (r = 0.95, n = 11 events) before stimulation and the regression line y (Cv amplitude of the downward step) = (0.8 ± 0.1) × x (Cv amplitude of the upward step) + (0.26 ± 0.10) (r = 0.76, n = 64 events) after the stimulation (open circles). The slopes of both regression lines were similar (p = 0.2). b, The relationship between the average Cv amplitudes of downward versus upward discrete steps of reversible events in distinct membrane patches before and after the addition of cAMP-increasing agents. The solid line represents linear fit of the controls: y (the average Cv amplitudes of downward steps) = (0.97 ± 0.04) × x (the average Cv amplitudes of upward steps) + (−0.03 ± 0.15) (r = 0.99, n = 9 cells), and the hyphenated line represents linear fit to the data obtained after the addition of cAMP-increasing agents: y (the average Cv amplitudes of upward steps) = (1.04 ± 0.02) × x (the average Cv amplitudes of downward steps) + (−0.03 ± 0.05) (r = 0.99, n = 16 cells). The slopes of both regression lines were similar (p = 0.3). Values are mean ± SEM. c, Distribution of Cv amplitudes of all events in control conditions shows two population best fitted with Gaussian curves with means: 0.58 ± 0.01 fF (r = 0.82) and 1.44 ± 0.02 fF (r = 0.80), each corresponding to 50% of all events in control conditions. After dbcAMP, we only observed one population best fitted with Gaussian curve with mean 0.61 ± 0.01 fF (r = 0.99) that represents 93% of all events after dbcAMP.
Figure 4.
Figure 4.
cAMP-increasing agents affect the fusion pore conductance and the pore dwell time. a, The average Gp, determined for reversible events with measurable crosstalk between Re and Im traces in controls, was 23 ± 2 pS (n = 75 events). The addition of IBMX, forskolin, and dbcAMP increased the average Gp to 21 ± 1 pS (n = 139 events; p = 0.3), 30 ± 1 pS (141 events; p < 0.001), and 32 ± 6 pS (n = 9 events; p < 0.05), respectively. Values are mean ± SEM. b, The average fusion pore dwell time of controls was 0.19 ± 0.02 s (n = 275 events) and remained unchanged after the addition of IBMX and forskolin (0.19 ± 0.02 s; n = 640 events and 0.21 ± 0.02 s; n = 219 events, respectively). dbcAMP treatment increased the average fusion pore dwell time to 0.40 ± 0.02 s (n = 1145 events, p < 0.001). Values are mean ± SEM. c, Fusion pore conductance displayed as a function of Cv > 1 fF (white columns) and Cv < 1 fF (black columns). d, Changes in fusion pore dwell time displayed as a function of Cv > 1 fF (white columns) and Cv < 1 fF (black columns). e, The frequency distribution of fusion pore dwell times in controls and after the addition of cAMP increasing agents. Arrows in the panel showing the distribution of fusion pore dwell times after the addition of dbcAMP (+dbcAMP) point to the modal values of the dwell times, which belong to the respective bursts. Two modal dwell times, which are marked with the cross and the dot, denote two bursts, shown in Figure 5a, b. *p < 0.05. **p < 0.01.
Figure 5.
Figure 5.
The addition of dbcAMP results in rhythmic reopening of the same fusion pore. a, b, Two epochs of the representative Im traces showing rhythmic fusion pore activity in two different cells after the addition of dbcAMP. This activity was part of two bursts (Fig. 1e for definition) with durations of 180 and 41 s. c–e, Representative histograms of times in between ensuing transient exocytic events within a burst in controls (c) and after the addition of dbcAMP (d,e). The histogram of controls shows a random distribution, whereas histograms after the addition of dbcAMP (which are partially shown in a,b) appear normally distributed and were fitted with Gaussian curves with the mean values of 0.465 ± 0.001 s (n = 645 events) and 1.166 ± 0.002 s (n = 26 events), respectively. f, The number of reversible events in a burst depends on the burst duration. The control data points were fitted with the regression line (dotted line) with parameters: y (number of events per burst) = (0.30 ± 0.27) × x (burst duration in seconds) + (10 ± 6) (correlation coefficient r = 0.41, n = 8 bursts, p = 0.3) and after stimulation with cAMP (solid line): y (number of events per burst) = (0.56 ± 0.08) × x (burst duration in seconds) + (6 ± 2) (correlation coefficient r = 0.76, n = 44 bursts, p < 0.001). The number of bursts of controls is much reduced. g, The time between consecutive reversible events in a burst did not depend on the burst duration. Control data points were fitted with the regression line (dotted line) with parameters: y (time between consecutive reversible events in a burst in seconds) = (0.025 ± 0.015) × x (burst duration in seconds) + (0.8 ± 0.3) (correlation coefficient r = 0.57, n = 8 bursts, p = 0.1); and after cAMP stimulation, data points were fitted with the regression line (solid line) with parameters: y (time between consecutive reversible events in a burst in seconds) = (0.013 ± 0.007) × x (burst duration in seconds) + (0.9 ± 0.2) (correlation coefficient r = 0.27, n = 44 bursts, p = 0.08). The burst duration of controls was typically <20 s. h, The cumulative number of reversible events as a function of time in a representative control cell. Arrows indicate bursts of reversible events. Inset, Magnified epoch (rectangle) where the time between ensuing reversible events is random. i, The cumulative number of reversible events as a function of time in a representative cell after the addition of dbcAMP. Arrows indicate bursts of reversible events. Inset, Magnified burst (rectangle) with remarkably constant time between ensuing reversible events.
Figure 6.
Figure 6.
The presence of cAMP-increasing agents affects the relationship between the fusion pore diameter and the vesicle diameter. a, Scatter plot diagram of fusion pore conductance versus vesicle capacitance of respective reversible events in controls (full circles) and after the addition of cAMP increasing agents (empty symbols). Respective data points were best fitted with: y (Gp) = (2.3 ± 0.5) × x (Cv) + (16 ± 2) (control, dashed line, r = 0.48) and y (Gp) = (7.0 ± 0.5) × x (Cv) + (11 ± 1) (cAMP-increasing agents, solid line, r = 0.61). Both slopes are significantly different from each other (p < 0.001). Significance was tested using one-way ANCOVA for two independent samples. b, Model describing the effect of cAMP on exocytotic cycle of lactotroph vesicles.

Similar articles

Cited by

References

    1. Alés E, Tabares L, Poyato JM, Valero V, Lindau M, Alvarez de Toledo G. High calcium concentrations shift the mode of exocytosis to the kiss-and-run mechanism. Nat Cell Biol. 1999;1:40–44. doi: 10.1038/9012. - DOI - PubMed
    1. Alvarez de Toledo G, Fernández-Chacón R, Fernández JM. Release of secretory products during transient vesicle fusion. Nature. 1993;363:554–558. doi: 10.1038/363554a0. - DOI - PubMed
    1. Angleson JK, Cochilla AJ, Kilic G, Nussinovitch I, Betz WJ. Regulation of dense core release from neuroendocrine cells revealed by imaging single exocytotic events. Nat Neurosci. 1999;2:440–446. doi: 10.1038/8107. - DOI - PubMed
    1. Barg S, Olofsson CS, Schriever-Abeln J, Wendt A, Gebre-Medhin S, Renström E, Rorsman P. Delay between fusion pore opening and peptide release from large-dense-core vesicles from neuroendocrine cells. Neuron. 2002;33:287–299. doi: 10.1016/S0896-6273(02)00563-9. - DOI - PubMed
    1. Ben-Tabou S, Keller E, Nussinovitch I. Mechanosensitivity of voltage-gated calcium currents in rat anterior pituitary cells. J Physiol. 1994;476:29–39. - PMC - PubMed

Publication types

MeSH terms

LinkOut - more resources