

doi: 10.1523/JNEUROSCI.5458-12.2013.
Ventral hippocampal neurons are shaped by experience to represent behaviorally relevant contexts
Affiliations
- PMID: 23637197
- PMCID: PMC3667351
- DOI: 10.1523/JNEUROSCI.5458-12.2013
Item in Clipboard
Ventral hippocampal neurons are shaped by experience to represent behaviorally relevant contexts
J Neurosci.
.
Abstract
Memories can be recalled at different levels of resolution, from a detailed rendition of specific events within a single experience to a broad generalization across multiple related experiences. Here we provide evidence that neural representations reflecting the specificity or generality of memories are differentially represented along the dorsoventral axis of the CA3 area of the rat hippocampus. In dorsal CA3, neurons rapidly associate the identity of events with specific locations whereas, in more ventrally located CA3 regions, neurons gradually accumulate information across extended training to form representations that generalize across related events within a spatial context and distinguish events across contexts.
Figures
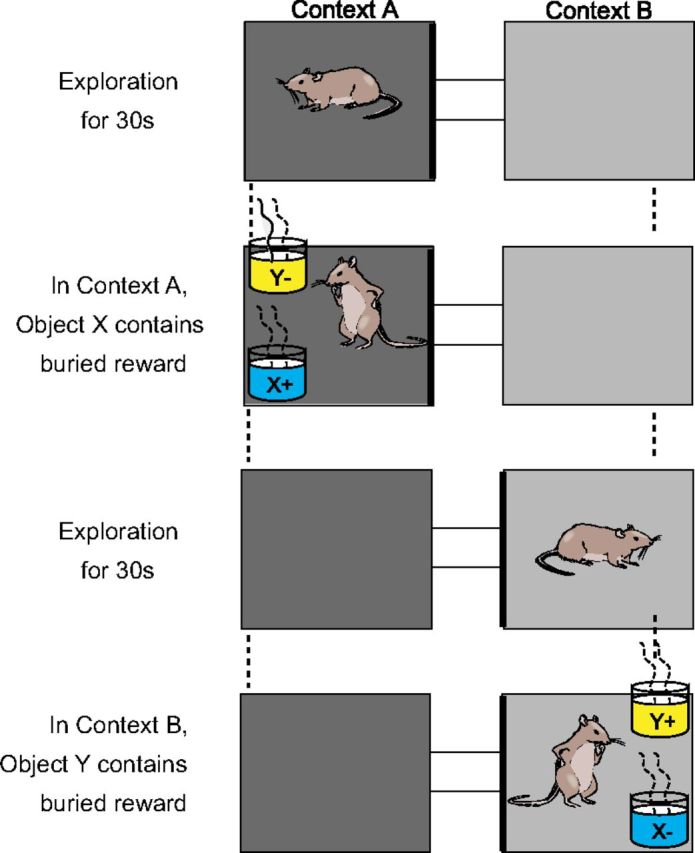
Context-guided object-association task. Successive context exploration and object sampling periods of two example trials. “+” indicates rewarded object and “−” indicates nonrewarded object in each context.
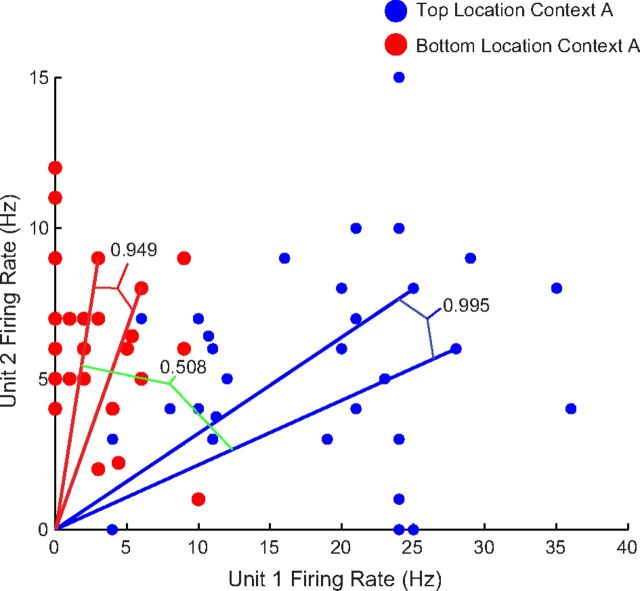
Ensemble cosine similarity analysis. Firing rates during object sampling events of units 1 and 2, a subset of the total ensemble recorded in an animal during a learning session, are plotted with respect to the x- and y-axes. All events occurring at the top location within Context A are in blue and all events at the bottom location are plotted in red. For simplicity, this figure uses raw firing rates; however, subsequent analyses used z-score transformations of the firing rate (see Materials and Methods).

Effect of complete hippocampal lesion on performance. A, Infusion coordinates of NMDA or saline for controls targeted bilateral hippocampus at 14 sites, 7 per hemisphere. B, Depicted are the five coronal sections used to evaluate the extent of the lesions. Starting from the top left and going down the sections are −2.16 mm, −3.0 mm, −4.8 mm, −5.64 mm, and −6.36 mm anteroposterior. Gray shows the largest lesion extent for that section and black the smallest lesion extent observed at that level. C, Average (±SE) after surgical performance on object-context task; *p < 0.05 for the between group comparison. The dotted line reflects chance performance (50%).
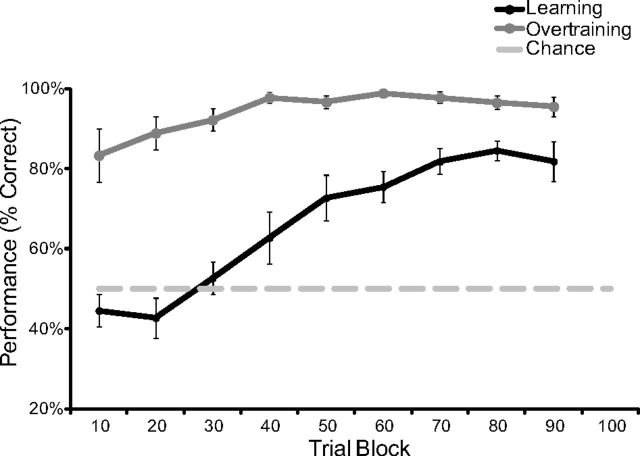
Performance in learning and overtraining. The learning curve represents the average performance of 11 rats within bins of 10 trials. The extended training curve reflects performance of 9 of the same 11 rats across nine sessions. Performance did increase significantly during overtraining (repeated-measures ANOVA: F(8,64) = 3.217; p = 0.004; n = 9), but was significantly different from learning (repeated-measures ANOVA interaction: F(8,144) = 5.687; p < 0.001). Error bars indicate 1 ± SEM.
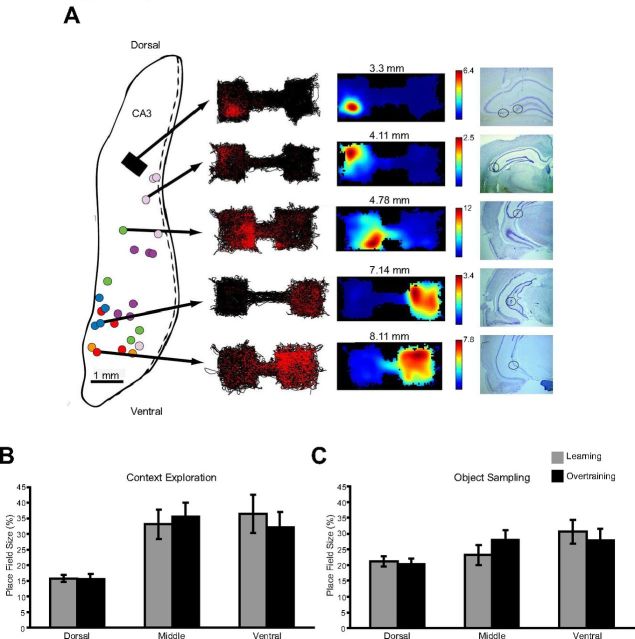
Place field sizes in learning and with overtraining. A, Tetrode locations and example spatial firing patterns and place fields. Tetrodes in the five rats from our previous study (Komorowski et al., 2009) were often too close together to determine their exact location, and therefore are represented by gray boxes. Tetrode locations for the six new rats are depicted in colored circles with locations for each rat in the same color on a 2D flattened map of hippocampus (Swanson et al., 1978). To the right shows the spatial firing plots for five cells selected from different recording depths in rats during the extended training condition. On the left is the rat's path (black lines) along with red dots indicating the location where spikes occurred. To the right are normalized spatial firing rate maps generated from the spiking data. Histological sections show the tetrode location for each example cell. B, Place field size measured during the context exploration period. Error bars indicate average place field size (±SE) as a percentage of the context for neurons in dorsal, middle, and ventral CA3. C, Same place field measures for the object sampling period.
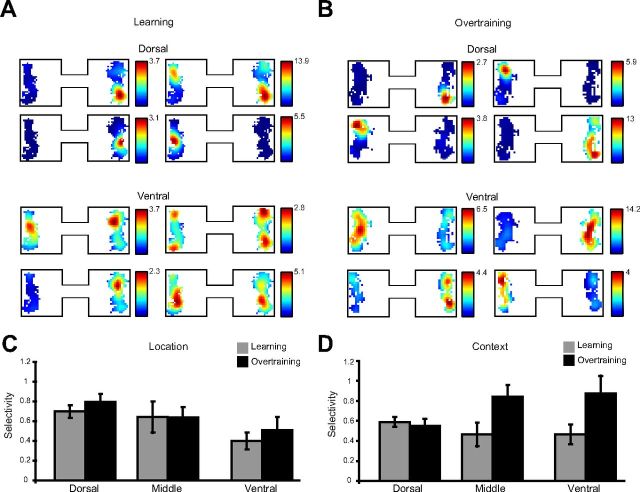
Location and context selectivity during object sampling. Normalized spatial firing rate maps for the object sampling period in the learning session (A) and in overtraining sessions (B). Each set of plots represents the spatial firing patterns of four example neurons. C, Average (±SE) single cell location selectivity during object sampling in learning and overtraining sessions. Location selectivity was measured as the difference in z-score normalized firing rate between a cell's preferred object location (location with the maximum firing rate) and the other location, within the same context. D, Average (±SE) single cell context selectivity measured as the difference in z-score normalized firing rate between a cell's preferred object context (context with the maximum firing rate across both locations) and the other context.
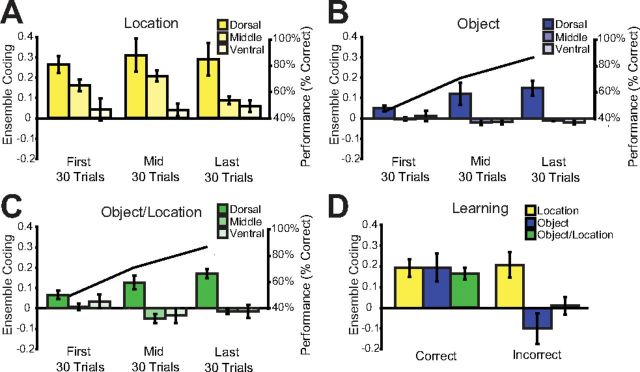
Object sampling ensemble coding within learning sessions. A, Average (±SE) location coding across all rats in dorsal, intermediate, and ventral CA3 is shown in the first, middle, and last 30 trials of the learning session. The middle 30 trials were centered on the trial block in which the rat achieved our learning criterion (see Materials and Methods). B, C, Average (±SE) Object and Object/Location coding in the same conditions as Fig 6A. Black line represents average performance across all rats within each 30 trial block. D, Comparison of Location, Object, and Object/Location coding on trials in which the animal eventually made a correct versus incorrect choice. Averages here are not binned and reflect all trials within the learning session.
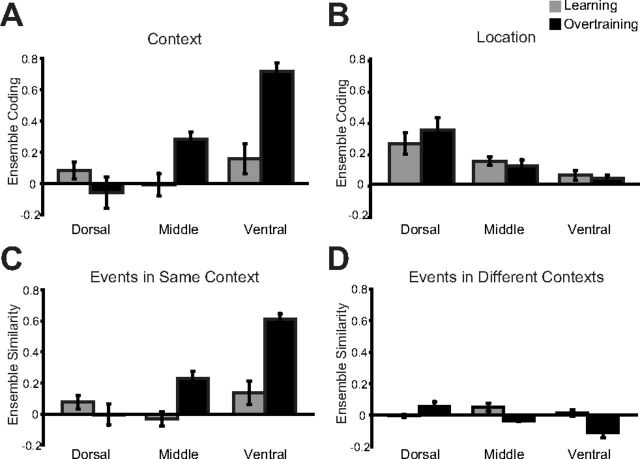
Object sampling ensemble coding comparing learning and overtraining sessions. A, Average (±SE) Context coding in dorsal, intermediate, and ventral hippocampus is shown in learning and in overtraining sessions. B, Same plots, now for location coding. C, D, Breakdown of context coding results depicted in Figure 7A into its components of average ensemble coding between pairs of object sampling events within the same context, but at different locations (C) and average (±SE) ensemble coding between pairs of object sampling events in different contexts.
References
Publication types
MeSH terms
Substances
Grants and funding
LinkOut - more resources
Full Text Sources
Other Literature Sources
Miscellaneous