. 2013 Jun 21;288(25):18381-91.
doi: 10.1074/jbc.M113.478420. Epub 2013 May 1.

Sphingosine-1-phosphate phosphatase 1 regulates keratinocyte differentiation and epidermal homeostasis

Affiliations

Sphingosine-1-phosphate phosphatase 1 regulates keratinocyte differentiation and epidermal homeostasis

Maria L Allende et al. J Biol Chem. .

Abstract

Sphingosine 1-phosphate (S1P) is a bioactive lipid whose levels are tightly regulated by its synthesis and degradation. Intracellularly, S1P is dephosphorylated by the actions of two S1P-specific phosphatases, sphingosine-1-phosphate phosphatases 1 and 2. To identify the physiological functions of S1P phosphatase 1, we have studied mice with its gene, Sgpp1, deleted. Sgpp1(-/-) mice appeared normal at birth, but during the 1st week of life they exhibited stunted growth and suffered desquamation, with most dying before weaning. Both Sgpp1(-/-) pups and surviving adults exhibited multiple epidermal abnormalities. Interestingly, the epidermal permeability barrier developed normally during embryogenesis in Sgpp1(-/-) mice. Keratinocytes isolated from the skin of Sgpp1(-/-) pups had increased intracellular S1P levels and displayed a gene expression profile that indicated overexpression of genes associated with keratinocyte differentiation. The results reveal S1P metabolism as a regulator of keratinocyte differentiation and epidermal homeostasis.

Keywords: Epidermis; Keratinocytes; Metabolism; Sgpp1; Sphingolipid; Sphingosine-1-phosphate.


Figures
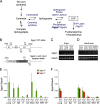
FIGURE 1.
FIGURE 1.
Generation of Sgpp1 knock-out mouse line by Sgpp1 gene disruption. A, intracellular metabolic pathway of S1P. B, schematic representation of the Sgpp1 gene targeting strategy. The structure of the mouse Sgpp1 locus is shown at the top, and the structure of the Sgpp1 targeted allele is shown at the bottom. Arrows F1, F2, and R represent the primers used for genotyping; arrows rt1 and rt2 represent the primers used in semiquantitative RT-PCR. C and D, mRNA expression for Sgpp1 (top gels) and Gapdh (bottom gels) determined by semiquantitative RT-PCR of various tissues from Sgpp1+/+ (WT) and Sgpp1−/− (KO) 2-day-old (C) and adult (D) mice. E and F, mRNA expression for Sgpp1 (E) and Sgpp2 (F) determined by RT-qPCR of various tissues from Sgpp1+/+ and Sgpp1−/− adult mice. LIv, liver; Spl, spleen; H, heart; Col, colon; Stom, stomach; Kid, kidney; WAT, white adipose tissue; Br, brain. The relative level of Gapdh mRNA expression in each sample was set to 1. Bars represent mean values ± S.D. Student's t test, n = 4.
FIGURE 2.
FIGURE 2.
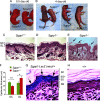
Sgpp1−/− pups exhibit focal desquamation and abnormal epidermal histology. A and B, Sgpp1+/+ and Sgpp1−/− mice at 0.5 days (A) and 4 days after birth (B). The arrows in B indicate sites of desquamation. C–E, histology of Sgpp1-deficient mouse skin. Paraffin sections of back skin from 2-day-old Sgpp1+/+ (C) and Sgpp1−/− (D and E) mice were stained with H&E. E represents a region of back skin undergoing peeling of the stratum corneum (marked by arrows). Bar, 200 μm. SC, stratum corneum; SL, subcorneal layer. F, stratum corneum and subcorneal layer thicknesses in 2-day-old Sgpp1+/+ and Sgpp1−/− mice. Bars represent mean values ± S.D. n = 4 for each genotype. Student's t test; *, p < 0.05; **, p < 0.01. G and H, activity of β-galactosidase, a surrogate marker for Sgpp1 expression, in 2-day-old mouse skin section. Sgpp1+/− (Sgpp1-LacZ (neo)/+) (G) and Sgpp1+/+ (+/+) (H) skin sections are shown. Arrows in G mark the keratinocyte layers that express β-galactosidase as a marker of Sgpp1 expression. This staining is absent in the +/+ skin section (H). Bar, 50 μm. SC, stratum corneum; SG, stratum granulosum; SS, stratum spinosum; SB, stratum basale.
FIGURE 3.
FIGURE 3.
Epidermal permeability barrier formation was normal in Sgpp1−/− mice. Epidermal barrier acquisition was tested by resistance to toluidine blue staining at early embryonic (E) day E16 (A and B), late day E16 (C and D), and at 3 days after birth (E). Embryos are viewed dorsally (A and C) and ventrally (B and D). In the 3-day-old pups (E), the arrow indicates an area of desquamation that stained with toluidine blue.
FIGURE 4.
FIGURE 4.
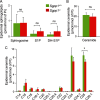
Sphingolipid profile in Sgpp1−/− mouse epidermis. The sphingolipid profile was determined by HPLC-tandem MS on epidermis isolated from Sgpp1+/+ and Sgpp1−/− 2-day-old pups. Levels of sphingosine, S1P, and dihydro-S1P (A), total ceramide (B), and individual ceramide species with different fatty-acid chain lengths (C) were determined. Values are expressed as picomoles of sphingolipid per nmol of inorganic phosphorous (Pi). Bars represent mean values ± S.D. n = 5 for each genotype. Student's t test; *, p < 0.05. ns, not significant.
FIGURE 5.
FIGURE 5.
Expression of proliferation and keratinocyte differentiation markers are increased in Sgpp1−/− skin. Paraffin sections of 2-day-old skin from Sgpp1+/+ and Sgpp1−/− mice were stained with antibodies against Ki67 (A and B), keratin 6 (C and D), keratin 14 (E and F), keratin 10 (G and H), loricrin (I and J), filaggrin (K and L) (green staining), and DAPI (blue). The white line represents the outer edge of the stratum corneum to mark the skin limit on the top of the image. Bar, 100 μm.
FIGURE 6.
FIGURE 6.
Surviving Sgpp1−/− adult mice displayed abnormal skin phenotype. A, surviving adult Sgpp1−/− mouse and its Sgpp1+/+ littermate. Arrows indicate the deep constriction rings found on the tails of Sgpp1−/− mice. B and C, paraffin sections from Sgpp1+/+ (B) and Sgpp1−/− (C) adult mouse back skin stained with H&E. Bar, 200 μm. SC, stratum corneum; SL, subcorneal layer. D–K, immunohistochemistry of Sgpp1+/+ and Sgpp1−/− adult mouse skin. Paraffin sections were stained with antibodies against keratin 6 (D and E), keratin 14 (F and G), Ki67 antigen (H and I), filaggrin (J and K) (green staining), and DAPI (blue). The white line represents the edge of the stratum corneum to mark the skin limit on the top of the image. Bar, 100 μm.
FIGURE 7.
FIGURE 7.
Sphingolipid profile of Sgpp1−/− keratinocytes. Primary keratinocytes from skin of 1-day-old Sgpp1+/+ and Sgpp1−/− mice were grown in low Ca2+ media for 3–4 days. The sphingolipid profile of each culture was determined by HPLC-tandem MS. Levels of sphingosine, S1P, and dihydro-S1P (A), total ceramide (B), and individual ceramide fatty acid chain species (C) were determined. Values are expressed as picomoles of sphingolipid per nmol of inorganic phosphorous (Pi). Bars represent mean values ± S.D. n = 5 for each genotype. Student's t test; *, p < 0.05; **, p < 0.01; ***, p < 0.001. ns, not significant.
FIGURE 8.
FIGURE 8.
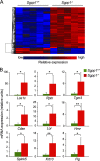
Gene expression profile of keratinocytes in vitro. A, microarray gene expression analysis was performed with RNA from five Sgpp1+/+ and five Sgpp1−/− keratinocyte cultures, isolated from individual mice, grown in low Ca2+ media for 3–4 days. The heat map shows the raw signal values of genes that are significantly different between Sgpp1+/+ and Sgpp1−/− groups, using a cutoff of p < 0.05 and a fold change of greater than 2. B, expression levels of nine genes among the top 50 determined by microarray analysis to be overexpressed in Sgpp1−/− keratinocytes were validated by RT-qPCR. Results are expressed as mean value ± S.D. n = 6 for both genotypes. Student's t test; *, p < 0.05; **, p < 0.01.
FIGURE 9.
FIGURE 9.
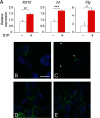
Role of S1P in keratinocyte differentiation. A, mouse keratinocytes were incubated with 10−7 m S1P for 2 days, and gene expression was determined by RT-qPCR. Data are expressed as mean value ± S.D., n = 3 for each phenotype, and is representative of three independent experiments. Student's t test; *, p < 0.05; **, p < 0.01; ***, p < 0.001. B–E, S1PR1-GPF receptor-expressing HEK293 cells were incubated for 60 min with C-DMEM (B), 10−7 m S1P (C), Sgpp1+/+ conditioned medium (D), and Sgpp1−/− conditioned medium (E). Cells were then fixed and examined using a Zeiss confocal laser scanning microscope under a ×63 oil objective. Bar, 20 μm.
FIGURE 10.
FIGURE 10.
Mechanism for the skin phenotype found in Sgpp1−/− mice. A and B, Ca2+ distribution was visualized in situ by Calcium Green-1 staining on frozen skin sections from Sgpp1+/+ (A) and Sgpp1−/− (B) pups. Arrows indicate staining of nucleated cells in the Sgpp1−/− sections. The white line represents the outer edge of the stratum corneum to mark the skin limit on the top of the image. Bar, 100 μm. B and C, proposed mechanism. The S1P phosphatase encoded by Sgpp1 is relatively highly expressed in differentiating keratinocytes. Its deletion in keratinocytes raises S1P levels, triggering Ca2+-induced keratinocyte differentiation, resulting in a compensatory increase in keratinocyte proliferation leading to increased desquamation.

Similar articles

Cited by

References

    1. Rivera J., Proia R. L., Olivera A. (2008) The alliance of sphingosine 1-phosphate and its receptors in immunity. Nat. Rev. Immunol. 8, 753–763 - PMC - PubMed
    1. Fyrst H., Saba J. D. (2010) An update on sphingosine 1-phosphate and other sphingolipid mediators. Nat. Chem. Biol. 6, 489–497 - PMC - PubMed
    1. Maceyka M., Harikumar K. B., Milstien S., Spiegel S. (2012) Sphingosine 1-phosphate signaling and its role in disease. Trends Cell Biol. 22, 50–60 - PMC - PubMed
    1. Hannun Y. A., Obeid L. M. (2008) Principles of bioactive lipid signalling: lessons from sphingolipids. Nat. Rev. Mol. Cell Biol. 9, 139–150 - PubMed
    1. Spiegel S., Milstien S. (2003) Sphingosine 1-phosphate: an enigmatic signalling lipid. Nat. Rev. Mol. Cell Biol. 4, 397–407 - PubMed

Publication types

MeSH terms