. 2013 Jun;24(12):2008-20.
doi: 10.1091/mbc.E13-03-0121. Epub 2013 May 1.

Deacylation on the matrix side of the mitochondrial inner membrane regulates cardiolipin remodeling

Affiliations

Deacylation on the matrix side of the mitochondrial inner membrane regulates cardiolipin remodeling

Matthew G Baile et al. Mol Biol Cell. 2013 Jun.

Abstract

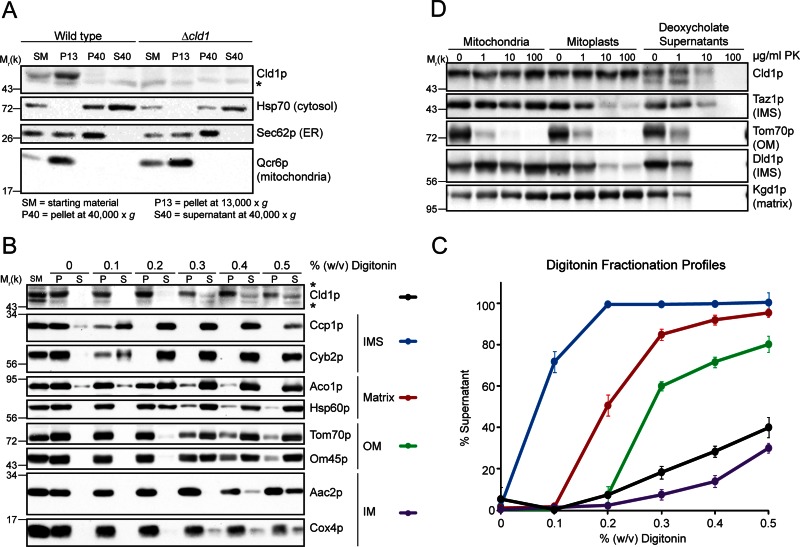
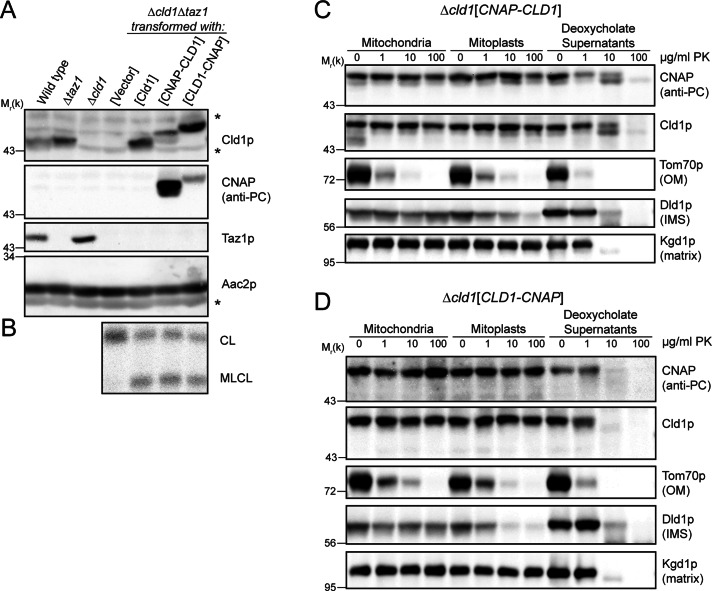
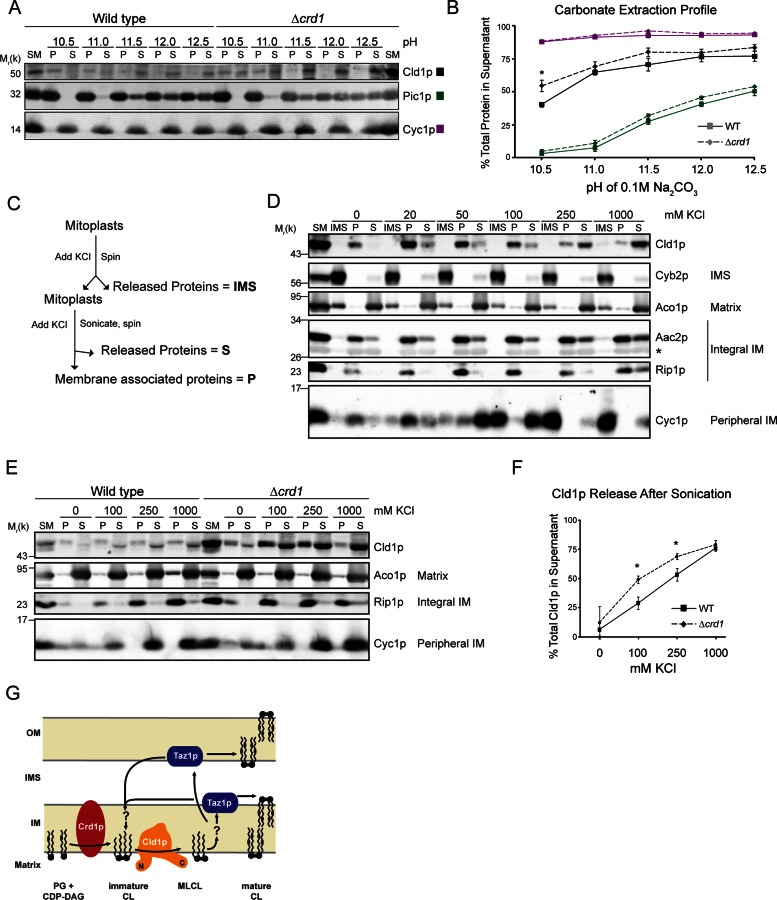
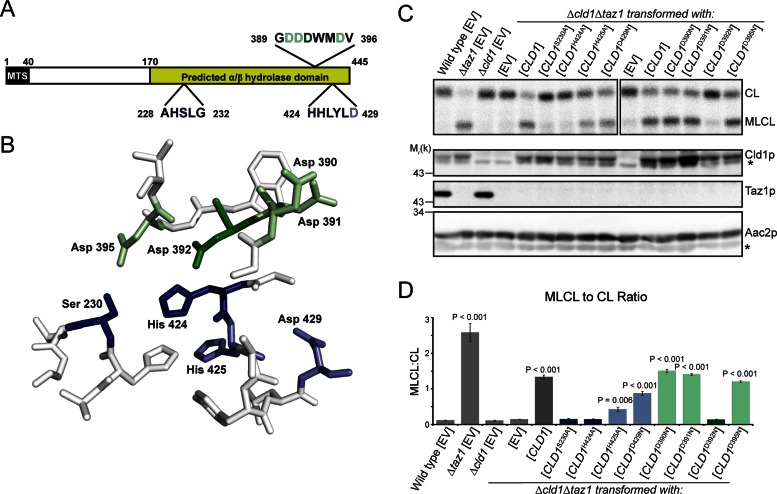
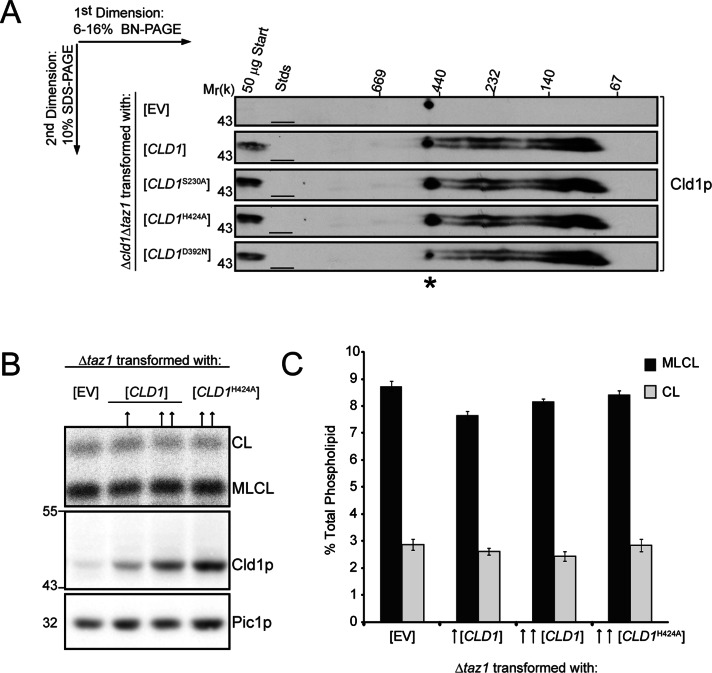
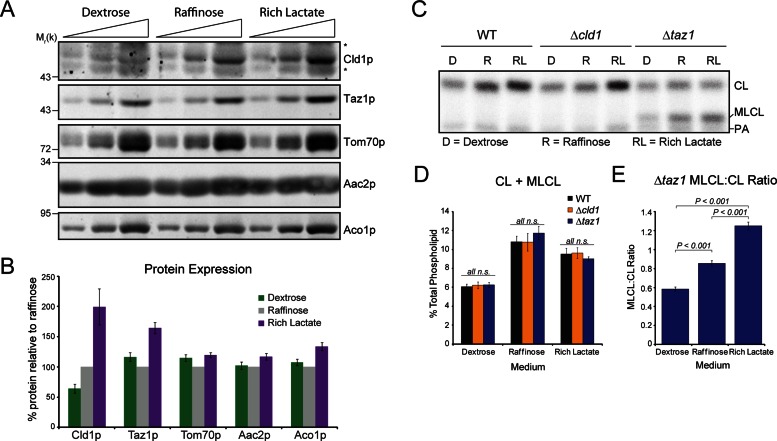
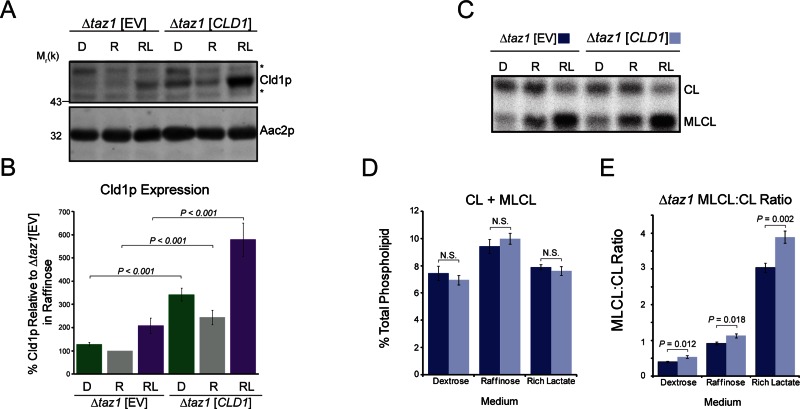
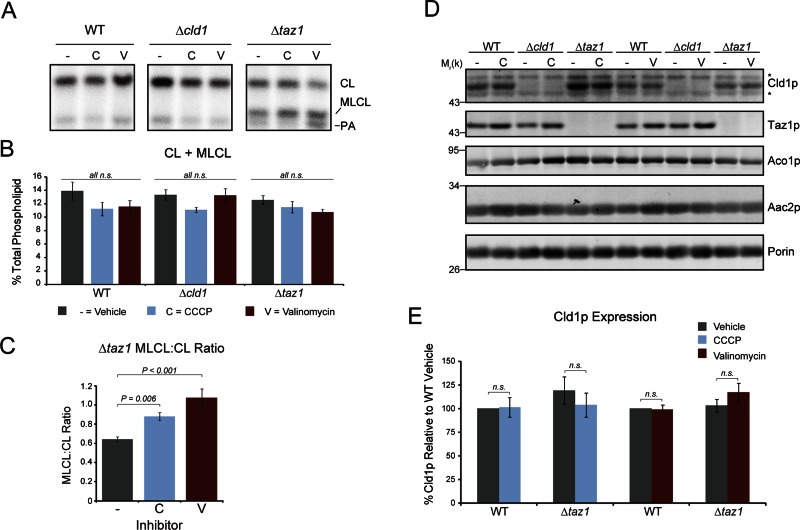
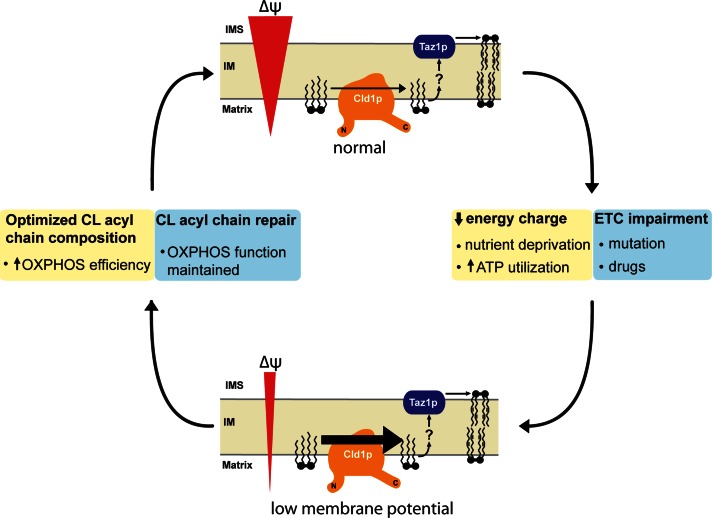
The mitochondrial-specific lipid cardiolipin (CL) is required for numerous processes therein. After its synthesis on the matrix-facing leaflet of the inner membrane (IM), CL undergoes acyl chain remodeling to achieve its final form. In yeast, this process is completed by the transacylase tafazzin, which associates with intermembrane space (IMS)-facing membrane leaflets. Mutations in TAZ1 result in the X-linked cardiomyopathy Barth syndrome. Amazingly, despite this clear pathophysiological association, the physiological importance of CL remodeling is unresolved. In this paper, we show that the lipase initiating CL remodeling, Cld1p, is associated with the matrix-facing leaflet of the mitochondrial IM. Thus monolysocardiolipin generated by Cld1p must be transported to IMS-facing membrane leaflets to gain access to tafazzin, identifying a previously unknown step required for CL remodeling. Additionally, we show that Cld1p is the major site of regulation in CL remodeling; and that, like CL biosynthesis, CL remodeling is augmented in growth conditions requiring mitochondrially produced energy. However, unlike CL biosynthesis, dissipation of the mitochondrial membrane potential stimulates CL remodeling, identifying a novel feedback mechanism linking CL remodeling to oxidative phosphorylation capacity.


Figures

FIGURE 1:
FIGURE 1:
Cld1p resides in the mitochondrial IM. (A) Yeast subcellular fractions were prepared by differential centrifugation. Fifty micrograms (for Cld1p) or 25 μg (for all other proteins) of each fraction was separated by SDS–PAGE and immunoblotted as indicated. (B and C) Mitochondria isolated from wild-type yeast were solubilized with the indicated concentration of digitonin. (B) Equal volumes of extracted (S) and nonextracted (P) protein for each digitonin concentration were separated by SDS–PAGE and immunoblotted. (C) The band intensities for two markers per compartment were combined and plotted as the percent of signal in the supernatant (mean ± SEM; n = 3). (D) Intact mitochondria, mitoplasts, or deoxycholate-solubilized mitochondria from wild-type yeast were incubated with the indicated concentrations of proteinase k (PK), and 50 μg of each sample was separated by SDS–PAGE and immunoblotted as indicated. *, nonspecific cross-reaction of the Cld1p antiserum.
FIGURE 2:
FIGURE 2:
Both termini of Cld1p face the matrix. (A) Whole-cell extracts were separated by SDS–PAGE and immunoblotted as indicated. *, a nonspecific cross-reaction of the Cld1p antiserum. (B) Mitochondrial phospholipids from the indicated strains were labeled with 32Pi and separated by thin-layer chromatography (TLC). (C and D) Intact mitochondria, mitoplasts, or deoxycholate-solubilized mitochondria from Δcld1 yeast transformed with (C) CNAP-CLD1 or (D) CLD1-CNAP were incubated with the indicated concentrations of PK, and 50 μg of each sample were separated by SDS–PAGE and immunoblotted as indicated.
FIGURE 3:
FIGURE 3:
Cld1p is associated with the matrix-facing leaflet of the IM. (A) Wild-type or Δcrd1 mitochondria were incubated in 0.1 M carbonate of the indicated pH. Membrane-bound proteins (P) were separated from released proteins (S) by ultracentrifugation, and equal volumes of each fraction were resolved by SDS–PAGE and immunoblotted as indicated. (B) Band intensities of the P and S fractions were quantified and plotted as the percentage of total protein released into the supernatant for each pH (mean ± SEM; n = 4). Solid and dashed lines indicate wild-type and Δcrd1 mitochondria, respectively. (C) Outline of the sonication experiment in (D). (D) Wild-type mitoplasts were incubated with the indicated concentration of KCl, and pelleted by centrifugation. Released proteins (IMS) in the supernatant were removed and TCA-precipitated. Mitoplasts were resuspended in buffer maintaining the indicated KCl concentration and sonicated. Membranes (P) were separated from released proteins (S) by ultracentrifugation. Equal amounts of each sample were resolved by SDS–PAGE and immunoblotted as indicated. (E) Intact wild-type or Δcrd1 mitochondria were sonicated in the presence of the indicated KCl concentrations as in (D). (F) Band intensities of the P and S fractions were quantified and plotted as the percentage of total protein released into the supernatant for each KCl concentration (mean ± SEM; n = 4). (G) Cld1p is embedded in the IM facing the mitochondrial matrix. (B and F) *, a statistically significant difference (p < 0.05) as determined by t test.
FIGURE 4:
FIGURE 4:
The catalytic triad of Cld1p. (A) Schematic of Cld1p, containing a predicted mitochondrial targeting sequence (MTS) and α/β-hydrolase domain. Amino acid residues mutated in the predicted lipase motif (residues 228–232) and acyltransferase structural motif (residues 424–429) are shown in blue with additional mutated residues in green. (B) The α/β-hydrolase domain of Cld1p was modeled with SWISS-MODEL. Residues constituting the predicted catalytic pocket of Cld1p are shown and colored as in (A). (C) Mitochondrial phospholipids from the indicated strains were labeled with 32Pi and separated by TLC (top panel). Whole-cell extracts were immunoblotted as indicated (bottom panels). (D) Quantification of the MLCL:CL ratio (mean ± SEM; n = 6). Significant differences compared with Δcld1Δtaz1[EV] were determined by one-way ANOVA. *, nonspecific bands.
FIGURE 5:
FIGURE 5:
Cld1p functions as a monomer. (A) Mitochondria (150 μg) isolated from the indicated strains were solubilized with 1.5% (wt/vol) digitonin, separated by two-dimensional blue native/SDS–PAGE, and immunoblotted for Cld1p. *, a nonspecific cross-reaction of the Cld1p antiserum. (B) Mitochondrial phospholipids from the indicated strains were labeled with 32Pi and separated by TLC (top panel). Whole-cell extracts from the indicated strains were resolved by SDS–PAGE and immunoblotted for Cld1p and the loading control Pic1p (bottom panels). ↑, a low copy (centromeric) plasmid; ↑↑, a high copy (2 μm) plasmid. (C) Quantification of CL and MLCL (mean ± SEM; n = 6).
FIGURE 6:
FIGURE 6:
Cld1p expression and function is modulated by the available carbon source. (A) Whole-cell extracts from wild-type yeast grown in YP-dextrose (Dextrose), YP-raffinose (Raffinose), or rich lactate were resolved by SDS–PAGE and immunoblotted as indicated. *, nonspecific cross-reactions of the Cld1p antiserum. (B) Band intensities from wild-type yeast were quantified and expressed as the % protein relative to raffinose (mean ± SEM; n = 17). (C) Mitochondrial phospholipids from yeast grown in the indicated media were labeled with 32Pi and separated by TLC. (D) The sum of CL + MLCL from the indicated strains (mean ± SEM; n = 6). n.s., differences not significant. (E) The ratio of MLCL:CL from Δtaz1 (mean ± SEM; n = 6). Significant differences determined by one-way ANOVA.
FIGURE 7:
FIGURE 7:
Cld1p overexpression does not cause a proportional increase in function. (A) Whole-cell extracts from Δtaz1 yeast transformed with an EV or CLD1 grown in YP-dextrose (D), YP-raffinose (R), or rich lactate (RL) were separated by SDS–PAGE and immunoblotted as indicated. *, nonspecific cross-reactions of the Cld1p antiserum. (B) Cld1p band intensities were quantified and plotted as the % protein relative to Δtaz1[EV] grown in raffinose (mean ± SEM; n = 8). (C) Mitochondrial phospholipids from yeast grown in the indicated media were labeled with 32Pi and separated by TLC. (D) The sum of CL + MLCL from the indicated strains (mean ± SEM; n = 6). n.s., differences not significant. (E) The ratio of MLCL:CL from Δtaz1 (mean ± SEM; n = 6). Significant differences determined by t test.
FIGURE 8:
FIGURE 8:
Dissipation of the mitochondrial membrane potential promotes Cld1p function. (A) Mitochondrial phospholipids from yeast grown in YP-raffinose spiked with 32Pi in the presence of 20 μM CCCP (C), 1 μM valinomycin (V), or vehicle only (−) for 24 h were separated by TLC. (B) The sum of CL + MLCL from the indicated strains (mean ± SEM; n = 6). n.s., differences not significant as determined by one-way ANOVA. (C) The ratio of MLCL:CL from Δtaz1 (mean ± SEM; n = 6). Significant differences determined by one-way ANOVA. (D) Whole-cell extracts from the indicated strains grown in the presence of CCCP, valinomycin, or vehicle alone for 24 h were resolved by SDS–PAGE and immunoblotted as indicated. *, nonspecific cross-reactions of the Cld1p antiserum. (E) Cld1p band intensities were quantified and plotted as the % Cld1p relative to wild-type grown in the absence of either ionophore (mean ± SEM; n = 5). n.s., differences not significant as determined by t test.
FIGURE 9:
FIGURE 9:
A feedback loop between OXPHOS and CL remodeling. CL remodeling is enhanced upon dissipation of the mitochondrial membrane potential (Δψ). Two potential underlying causes for a drop in the mitochondrial membrane potential include: 1) A decreased energy charge (yellow boxes) or 2) impairment of the electron transport chain (ETC), either through mutation or pharmacological insult (blue boxes). A reduced mitochondrial membrane potential will increase the rate of CL remodeling. The resultant additional mature CL may increase the efficiency of OXPHOS and thus reestablish the Δψ (yellow boxes). Alternatively, the increased production of ROS that occurs when proton pumping by the electron transport chain is reduced/impaired may oxidize CL. The increased rate of CL remodeling stimulated by the associated reduction in Δψ may therefore replace oxidized acyl chains in CL with new acyl chains, thus preserving OXPHOS function (blue boxes).

References

    1. Acehan D, Khuchua Z, Houtkooper RH, Malhotra A, Kaufman J, Vaz FM, Ren M, Rockman HA, Stokes DL, Schlame M. Distinct effects of tafazzin deletion in differentiated and undifferentiated mitochondria. Mitochondrion. 2009;9:86–95. - PMC - PubMed
    1. Acehan D, Malhotra A, Xu Y, Ren M, Stokes DL, Schlame M. Cardiolipin affects the supramolecular organization of ATP synthase in mitochondria. Biophys J. 2011;100:2184–2192. - PMC - PubMed
    1. Acehan D, Xu Y, Stokes DL, Schlame M. Comparison of lymphoblast mitochondria from normal subjects and patients with Barth syndrome using electron microscopic tomography. Lab Invest. 2007;87:40–48. - PMC - PubMed
    1. Arnold K, Bordoli L, Kopp J, Schwede T. The SWISS-MODEL workspace: a web-based environment for protein structure homology modelling. Bioinformatics. 2006;22:195–201. - PubMed
    1. Baile MG, Claypool SM. The power of yeast to model diseases of the powerhouse of the cell. Front Biosci. 2013;18:241–278. - PMC - PubMed

Publication types

MeSH terms