. 2013;11(4):e1001547.
doi: 10.1371/journal.pbio.1001547. Epub 2013 Apr 30.

feedback between population and evolutionary dynamics determines the fate of social microbial populations

Affiliations

feedback between population and evolutionary dynamics determines the fate of social microbial populations

Alvaro Sanchez et al. PLoS Biol. 2013.

Abstract

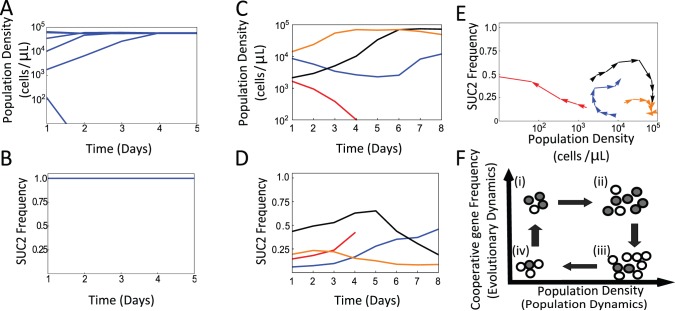
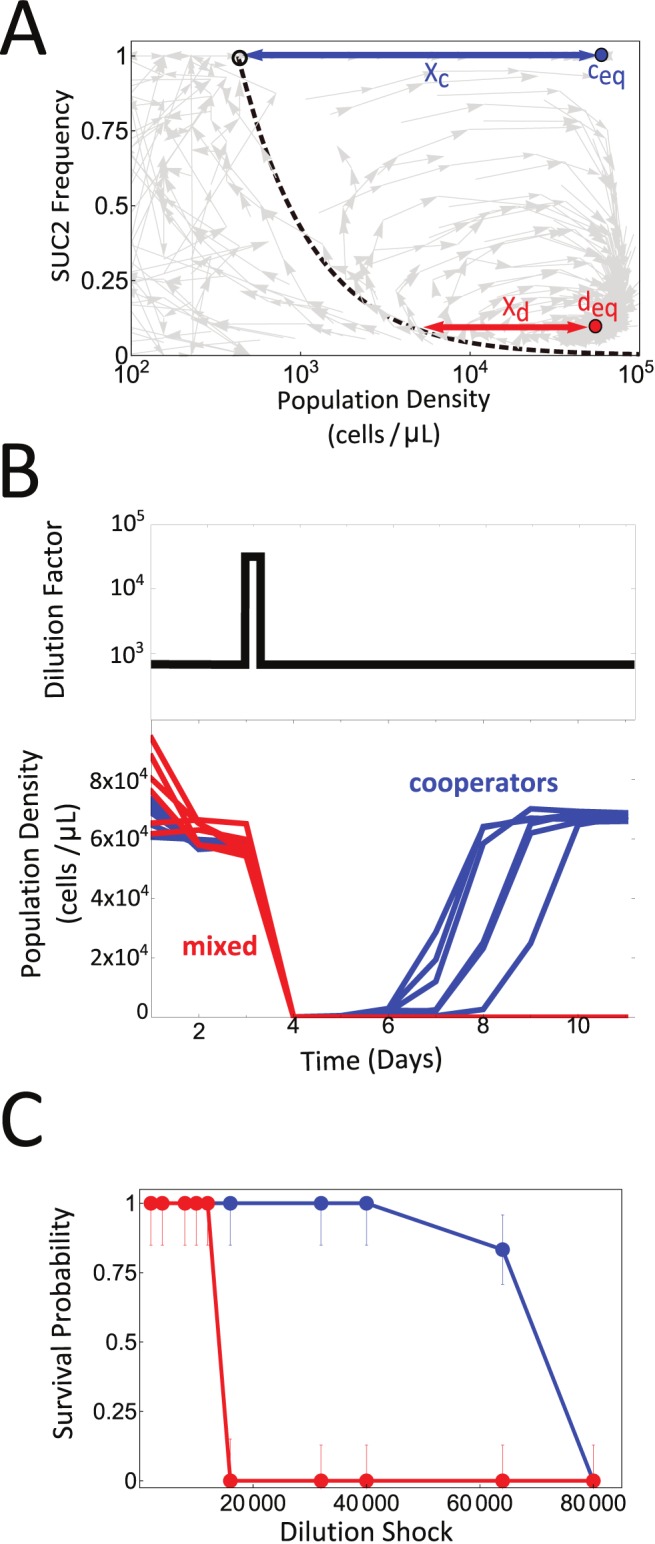
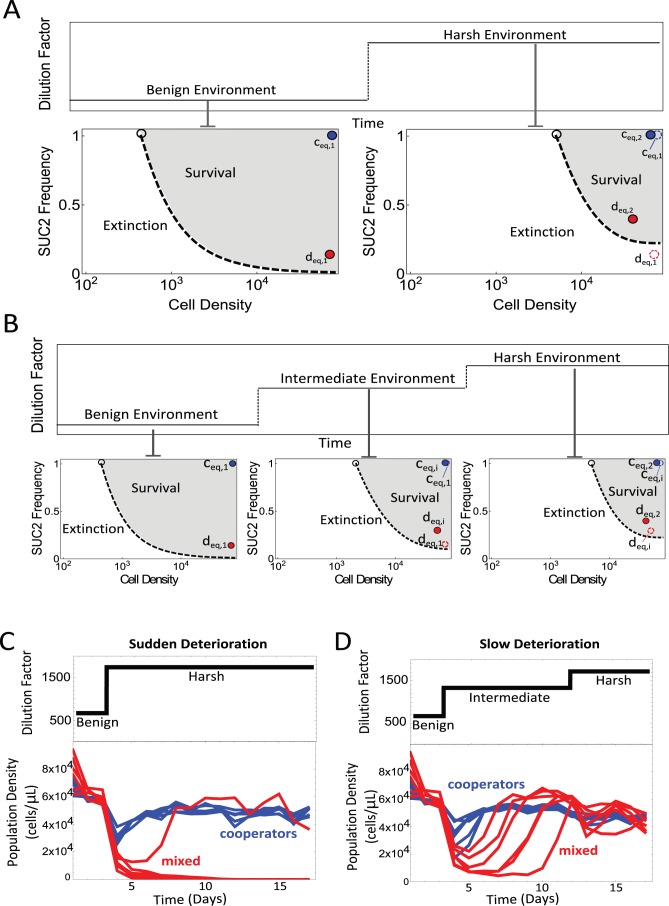
The evolutionary spread of cheater strategies can destabilize populations engaging in social cooperative behaviors, thus demonstrating that evolutionary changes can have profound implications for population dynamics. At the same time, the relative fitness of cooperative traits often depends upon population density, thus leading to the potential for bi-directional coupling between population density and the evolution of a cooperative trait. Despite the potential importance of these eco-evolutionary feedback loops in social species, they have not yet been demonstrated experimentally and their ecological implications are poorly understood. Here, we demonstrate the presence of a strong feedback loop between population dynamics and the evolutionary dynamics of a social microbial gene, SUC2, in laboratory yeast populations whose cooperative growth is mediated by the SUC2 gene. We directly visualize eco-evolutionary trajectories of hundreds of populations over 50-100 generations, allowing us to characterize the phase space describing the interplay of evolution and ecology in this system. Small populations collapse despite continual evolution towards increased cooperative allele frequencies; large populations with a sufficient number of cooperators "spiral" to a stable state of coexistence between cooperator and cheater strategies. The presence of cheaters does not significantly affect the equilibrium population density, but it does reduce the resilience of the population as well as its ability to adapt to a rapidly deteriorating environment. Our results demonstrate the potential ecological importance of coupling between evolutionary dynamics and the population dynamics of cooperatively growing organisms, particularly in microbes. Our study suggests that this interaction may need to be considered in order to explain intraspecific variability in cooperative behaviors, and also that this feedback between evolution and ecology can critically affect the demographic fate of those species that rely on cooperation for their survival.


Conflict of interest statement

The authors have declared that no competing interests exist.

Figures

Figure 1
Figure 1. Population dynamics in the presence and the absence of evolutionary dynamics.
Multi-day growth-dilution cycles demonstrate that evolutionary dynamics of a cooperative gene may dramatically affect population dynamics. (A–B) Yeast populations consisting exclusively of cooperator cells rapidly converge to an equilibrium population size in the absence of evolutionary dynamics (daily dilution by 667×). (C) Four different populations consisting of a mixture of SUC2 carriers and deletion mutants were subject to 8 days of growth dilution cycles. Populations started at different population densities and SUC2 frequencies in the population. (D) Evolutionary dynamics for the same four populations as in (C) are represented by the same colors. Plots of the population and evolutionary dynamics show seemingly erratic, non-monotonic behavior. (E) By constructing an eco-evolutionary phase-space formed by the population size and the frequency of the SUC2 gene in the population, we find that the four populations in (C–D) follow well defined trajectories. Each trajectory corresponds to the evolutionary and population dynamics of the same color. (F) A simple conceptual model rationalizes the eco-evolutionary trajectories; gray circles represent cooperators, white circles represent cheaters.
Figure 2
Figure 2. Visualization of eco-evolutionary trajectories.
(A) Simulation of the eco-evolutionary growth model (see Figure S1 and Text S1) over successive growth-dilution cycles. Gray arrows mark the day-to-day change in frequency of the SUC2 gene (f) and the population density (N). The eco-evolutionary phase space formed by N and f is divided in two regions by a separatrix line (black dashed). Above the separatrix, feedback between N and f results in trajectories spiraling toward an eco-evolutionary equilibrium point where cooperators and cheaters co-exist at deq (red dot). Below the separatrix populations go extinct despite the cooperators growing in frequency. Note that the low cell densities obtained in the region of the phase space below the separatrix led to larger experimental noise in the measurement of both frequency of cooperators and population size. In the absence of cheaters, the population dynamics have a stable fixed point at ceq (blue dot) and an unstable fixed point at cunstable (white circle). (B) Trajectories in the phase space for 60 cultures over five growth-dilution cycles. As predicted, a separatrix line divides the phase space in two regions: to the right trajectories spiral to an eco-evolutionary equilibrium and to the left trajectories lead to population collapse as cooperators increase in frequency. (C) A second set of 60 experimental populations were started in the vicinity of the co-existence equilibrium point deq and followed for 8 days, further illustrating the spiraling behavior and thus the presence of a feedback loop.
Figure 3
Figure 3. The presence of cheater cells decreases the resilience of a population.
(A) 180 eco-evolutionary trajectories corresponding to three different experiments are plotted in light gray. On top, we represent the population dynamics equilibrium point for pure cooperator cultures ceq (blue dot) and the eco-evolutionary equilibrium point deq (red dot). The blue arrow marks the distance between ceq and the separatrix (Xc), and the red arrow marks the horizontal distance between deq and the separatrix (Xd). (B) Populations were started near ceq (blue) or deq (red) at a dilution factor of 667×. A large disturbance was applied on the third day of culture, by increasing the dilution factor to 32,000× for one day (top panel). Pure cooperator populations were able to recover, but the mixed cooperator/cheater populations in eco-evolutionary equilibrium went extinct. (C) Survival probability as a function of the strength of the perturbation (i.e., dilution shock). The presence of cheaters (red circles) decreases the population resilience, i.e., the maximum dilution shock that the population can withstand, relative to pure cooperator populations (blue circles). Error bars were estimated assuming binomial sampling (n = 6), and represent a 68.27% confidence interval.
Figure 4
Figure 4. The presence of cheaters makes a population unable to survive rapidly deteriorating environments.
Our model predicts that the phase diagram is different for different dilution factors. Here we consider three environments: a “benign” environment, characterized by a low dilution factor; a “harsh” environment, characterized by a high dilution factor, and an “intermediate” environment with a moderate dilution factor. (A) We present the expected shifts in our phase diagram and equilibrium points as a result of a sudden environmental deterioration, as predicted by the model. In a benign environment, the mixed equilibrium point deq,1 is located at the bottom right side of the phase diagram (red dot). The basin of attraction for deq,1 (i.e., the survival zone) is shaded in gray. A sudden transition to a harsh environment (characterized by a jump in the dilution factor) causes a sudden change in the phase diagram, and leads to both a new survival zone and a new mixed equilibrium point deq,2. The point deq,1 is out of the survival zone for the harsh environment phase diagram (open circle, dashed), so we expect that a mixed population that was in equilibrium before the sudden environmental deterioration (and was therefore at deq,1) should go extinct. The pure-cooperator equilibrium point ceq,1 in the benign environment phase diagram is also presented (blue dot). A sudden change in the environment would not lead to the extinction of the pure cooperator population, since ceq,1 is within the basin of attraction of ceq,2 in the harsh environment phase diagram. (B) We present the expected shifts in the phase diagram if we introduce an intermediate step in the environmental deterioration. All of the phase diagrams were calculated from the model. We note that deq,1 is within the survival zone of the intermediate phase diagram (where deq,1 is represented as an open dot, red dashed stroke). In addition, deq,i (the mixed equilibrium point of the intermediate phase diagram) is within the survival zone of the harsh phase diagram (where deq,i is represented as an open dot, red dashed stroke). Therefore, a sudden transition from benign to intermediate environments does not lead to population extinction. For the same reason, a later transition from intermediate to harsh does not lead to extinction either. (C) These predictions were tested experimentally by bringing to equilibrium six pure cooperator populations and six mixed cooperator/cheater populations (all at a low dilution of 667×, characterizing a “benign” environment). The dilution factor was suddenly changed to 1,739× (characterizing a “harsh” environment) on day 3. All six pure cooperator populations tested (lower panel, blue) were able to withstand the rapid deterioration. However, only one out of six mixed populations (lower panel, red) were able to survive the rapid environmental deterioration. (D) A slow environmental deterioration was applied by increasing the dilution factor from 667× to 1,739× in two steps (upper panel); a first jump in dilution factor (to 1,333×, an “intermediate” environment) was imposed at day 2, and a second jump in dilution factor (to 1,739×) was imposed on day 12. In this case, all six mixed populations (red) were able to survive the deterioration (as did all six pure cooperator populations [blue]).

Comment in

References

    1. Schoener TW (2011) The newest synthesis: understanding the interplay of evolutionary and ecological dynamics. Science 331: 426–429. - PubMed
    1. Hastings A (1997) Population biology. New York: Springer.
    1. Post DM, Palkovacs EP (2009) Eco-evolutionary feedbacks in community and ecosystem ecology: interactions between the ecological theatre and the evolutionary play. Philos Trans R Soc Lond B Biol Sci 364: 1629–1640. - PMC - PubMed
    1. Grant PR, Grant BR (2006) Evolution of character displacement in Darwin's finches. Science 313: 224–226. - PubMed
    1. Pelletier F, Garant D, Hendry AP (2009) Eco-evolutionary dynamics. Philos Trans R Soc Lond B Biol Sci 364: 1483–1489. - PMC - PubMed

Publication types

MeSH terms

Substances

LinkOut - more resources