. 2013;9(4):e1003316.
doi: 10.1371/journal.ppat.1003316. Epub 2013 Apr 18.

Hepatitis C virus pathogen associated molecular pattern (PAMP) triggers production of lambda-interferons by human plasmacytoid dendritic cells

Affiliations

Hepatitis C virus pathogen associated molecular pattern (PAMP) triggers production of lambda-interferons by human plasmacytoid dendritic cells

Amy E L Stone et al. PLoS Pathog. 2013.

Erratum in

  • PLoS Pathog. 2013 Jun;9(6). doi:10.1371/annotation/6382d059-925d-4af7-b6f2-3669fc68ddfa

Abstract

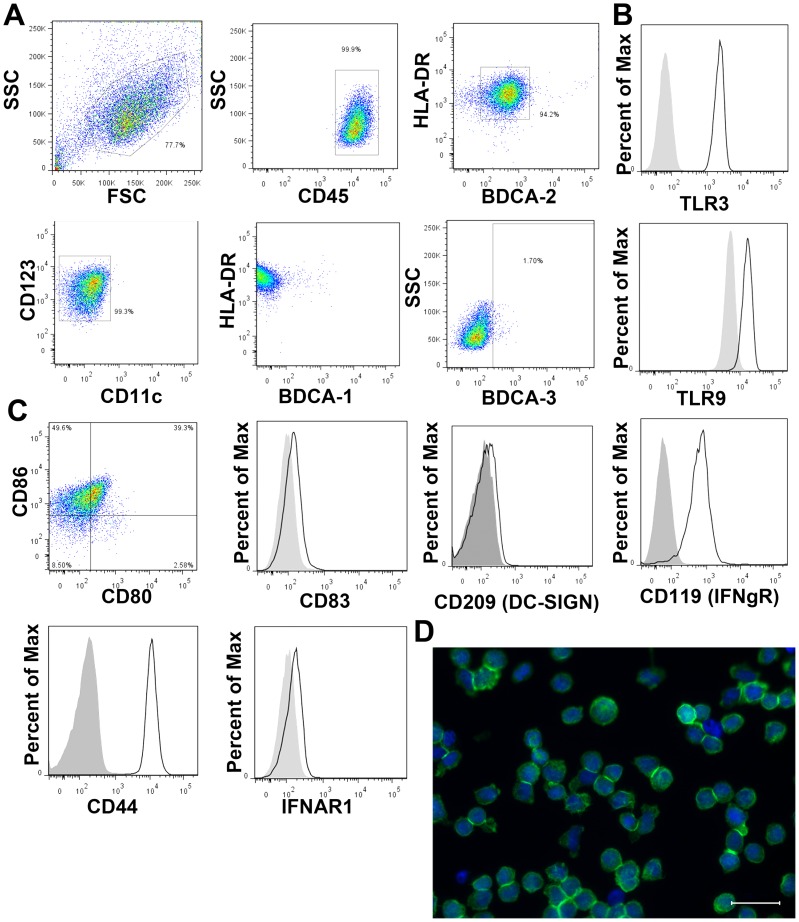
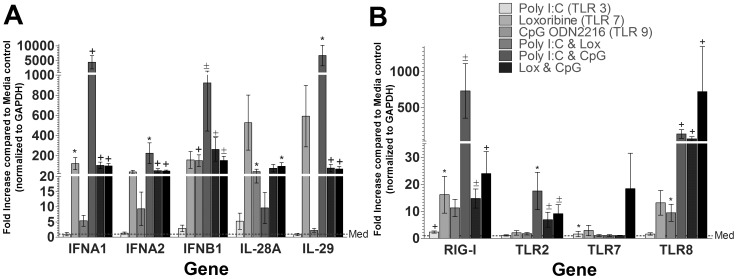
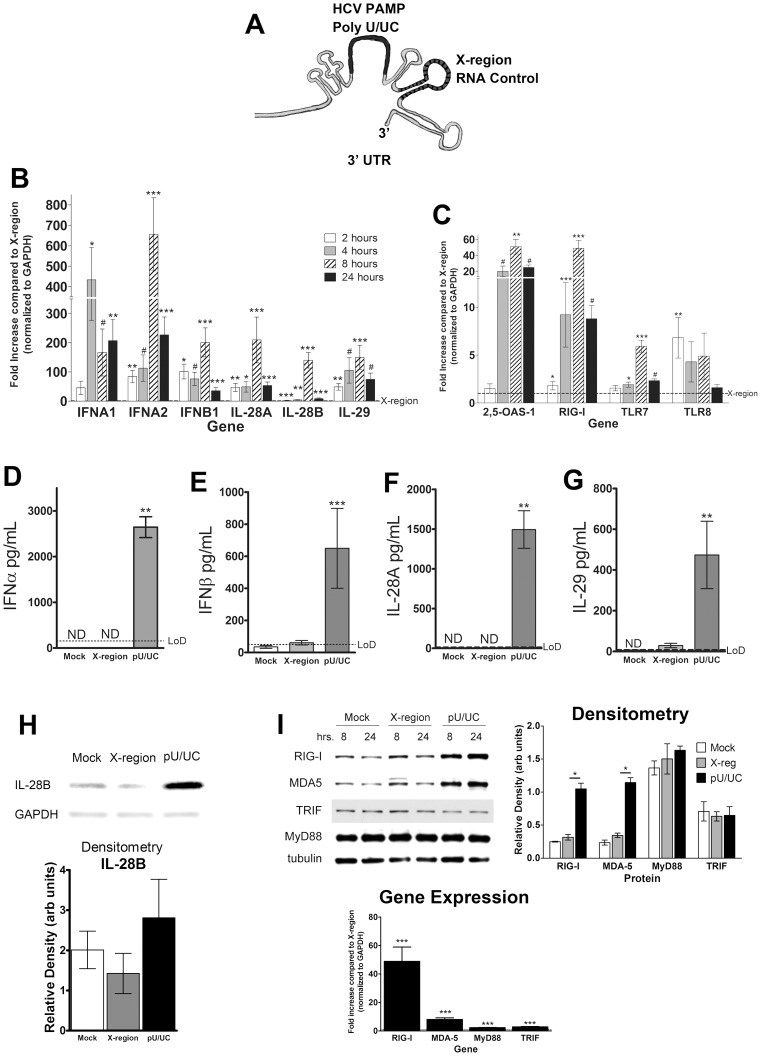
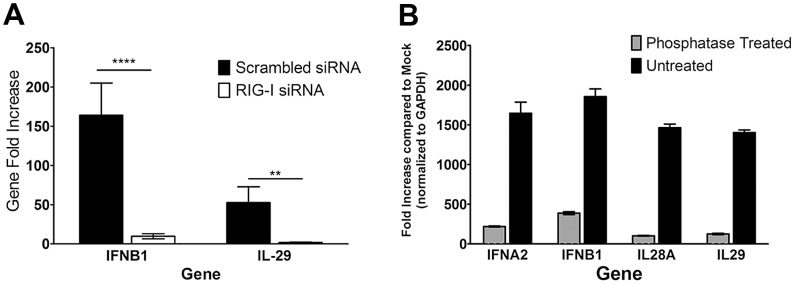
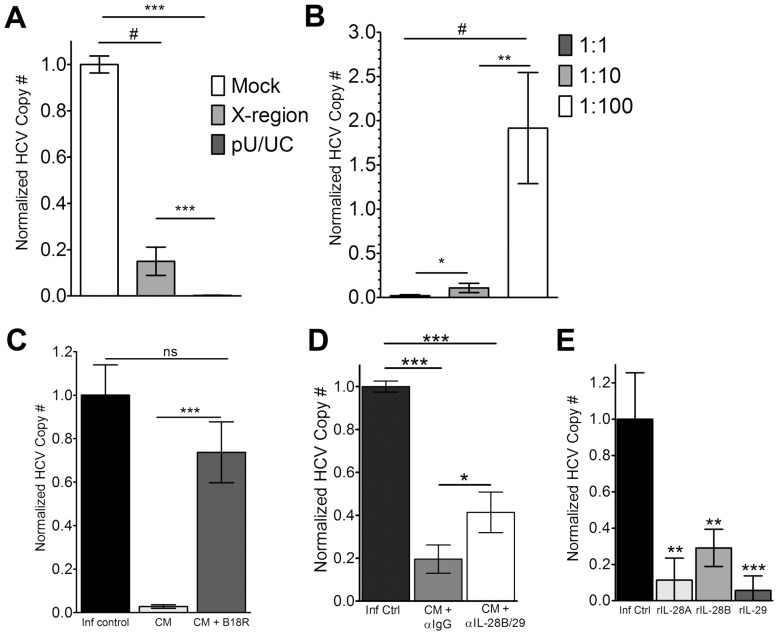
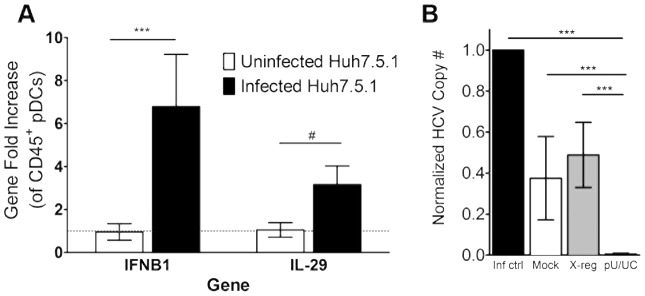
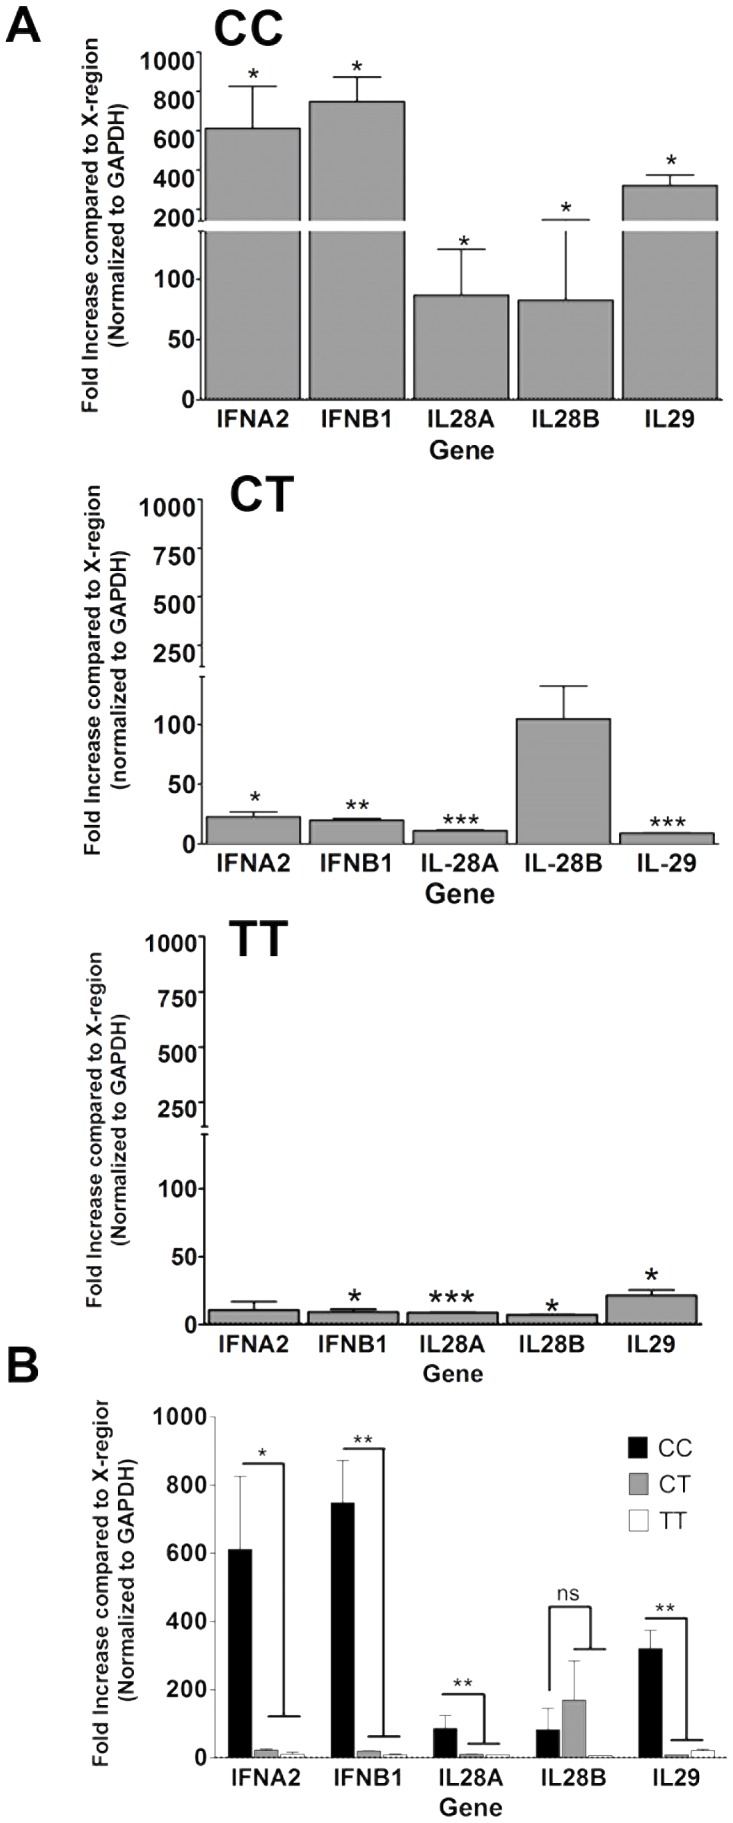
Plasmacytoid Dendritic Cells (pDCs) represent a key immune cell in the defense against viruses. Through pattern recognition receptors (PRRs), these cells detect viral pathogen associated molecular patterns (PAMPs) and initiate an Interferon (IFN) response. pDCs produce the antiviral IFNs including the well-studied Type I and the more recently described Type III. Recent genome wide association studies (GWAS) have implicated Type III IFNs in HCV clearance. We examined the IFN response induced in a pDC cell line and ex vivo human pDCs by a region of the HCV genome referred to as the HCV PAMP. This RNA has been shown previously to be immunogenic in hepatocytes, whereas the conserved X-region RNA is not. We show that in response to the HCV PAMP, pDC-GEN2.2 cells upregulate and secrete Type III (in addition to Type I) IFNs and upregulate PRR genes and proteins. We also demonstrate that the recognition of this RNA is dependent on RIG-I-like Receptors (RLRs) and Toll-like Receptors (TLRs), challenging the dogma that RLRs are dispensable in pDCs. The IFNs produced by these cells in response to the HCV PAMP also control HCV replication in vitro. These data are recapitulated in ex vivo pDCs isolated from healthy donors. Together, our data shows that pDCs respond robustly to HCV RNA to make Type III Interferons that control viral replication. This may represent a novel therapeutic strategy for the treatment of HCV.


Conflict of interest statement

The authors have declared that no competing interests exist.

Figures

Figure 1
Figure 1. pDC cell line resembles ex vivo pDCs.
A) Classic pDC surface phenotype. GEN2.2 cell line expresses the classic markers of ex vivo human pDCs: CD45+ HLA-DR+ BDCA-2+ CD123+ CD11c− BDCA-1− BDCA-3− (representative flow plots from 3 independent experiments). B) GEN2.2 cell line expresses intracellular TLR3 and TLR9. C) GEN2.2 cell line express costimulatory markers CD86 and CD44, CD119 (IFNγR) and express low levels of CD80, CD83, CD209 (DC-SIGN) and IFNαR1. D) GEN2.2 cellular morphology; Green – β-actin, Blue - Nuclei. Scale bar is 30 µm.
Figure 2
Figure 2. Robust Type I and III Interferon production following TLR ligation in pDC-GEN2.2 cells.
Fold increases for each gene at each condition are shown after normalization to reference gene GAPDH and are compared to stimulation of media alone (dashed line). A) Type I and Type III IFN genes are markedly upregulated after TLR stimulation (Type II IFNγ was not expressed; data not shown). The poly I:C and loxoribine combined condition elicited the most pronounced expression, indicating a synergistic effect of TLR3 and TLR7 ligation. B) TLR stimulation induces PRR gene upregulation, most prominently RIG-I and TLR8. p values represent the Wilcoxon signed rank result for each gene and condition as compared to media only condition. * p<0.05+p<0.01±p<0.001 # p≤0.0001. Bars represent the mean and error bars are +/− SEM.
Figure 3
Figure 3. pDC-GEN2.2 cells sense HCV PAMP and produce Type I and Type III IFNs.
A) Cartoon of the 3′ end of the HCV genome indicating the location of the poly U/UC (pU/UC, HCV PAMP) and the X-region in the 3′ UTR. Adapted from reference . B) Kinetics of interferon gene upregulation in GEN2.2 cells following transfection with the pU/UC RNA. Fold increases for each gene at each condition are shown after normalization to reference gene GAPDH and are compared to transfection with the X-region RNA (dashed line). Levels of IFN expression at 2 (white bars), 4 (gray bars), 8 (hashed bars) or 24 (black bars) hours are shown for each gene. C) Kinetics of PRR genes and ISGs show upregulation by pU/UC stimulation. Kinetics are shown as indicated in A for the IFN genes. D–G) Secretion of Type I and III IFNs by pDC-GEN2.2 cells following PAMP-stimulation. Increased production of D) IFNα, E) IFNβ, F) IL-28A/IFNλ2 and G) IL-29/IFNλ1 as detected by ELISA from pDC-GEN2.2 cells that have been stimulated with HCV PAMP compared to the X-region RNA. H) Western Blot of pDC-GEN2.2 cell lysates for IL-28B/IFNλ3 after 24 hours of HCV PAMP stimulation. The antibody was specific for IL-28B/IFNλ3 as it recognized low levels of recombinant IL-28B/IFNλ3 (rIL-28B; 10 ng) but failed to recognize recombinant IL-28A/IFNλ2 (rIL-28A; 5 µg). I) pU/UC-stimulation increases PRR signaling proteins in accordance to gene expression data. Western blots of listed PRR proteins after 8 or 24 hours stimulation with HCV PAMP RNA. B–C) Combined data from 5 independent experiments. D–I) Combined data from 3 independent experiments except for the gene expression graphs which are 5 independent experiments. H–I) Representative blots from 3 independent experiments. Densitometry shows relative density of each band after normalization to the reference protein. For gene expression graphs, p values are the Wilcoxon signed rank result for each gene and time point compared to the X-region stimulation from the same gene and time point. For ELISA and Densitometry graphs, p values are the Mann-Whitney result for the pU/UC condition compared to the X-region condition. * p<0.05 ** p<0.01 *** p<0.001 # p≤0.0001 Bars represent the mean and error bars are +/− SEM.
Figure 4
Figure 4. RIG-I contributes to the recognition of the HCV PAMP RNA and is necessary for IFN gene production by GEN2.2.
A) Gene expression graphs show that, after normalization to the reference gene GAPDH and Mock transfected condition, when compared to untreated HCV RNA, the phosphatases-treated RNA induced less interferon gene production. Data are representative graph from 3 independent experiments. Bars represent the mean and error bars are +/− SD. B) RIG-I was knocked down in pDC-GEN2.2 cells using siRNA and then stimulated with the pU/UC or X-region RNA. When compared to the Scrambled siRNA condition, the RIG-I knock-down condition (mean knock-down 13% by PCR) produced significantly less IFN mRNA. Combined data from 3 independent experiments. Bars represent the mean and error bars are +/− SEM. p values are the Mann-Whitney result for the scrambled siRNA condition compared to the RIG-I siRNA condition. * p<0.05 ** p<0.01 *** p<0.001 # p≤0.0001.
Figure 5
Figure 5. Replicative control of HCV in JFH-1/Huh7.5.1 system with conditioned media (CM) from pU/UC-transfected pDC-GEN2.2 cells.
Huh7.5.1 cells were infected for 24 hours prior to the addition of CM (A–D) or rIFNs (E) then 4 days later (5 days post-infection), cells were lysed and examined for HCV Copy number by qRT-PCR (see methods). A) Normalized JFH-1 copy number (see methods and below for calculation) after treatment with CM from Mock (negative; white bars)-, X-region (gray bars)- or pU/UC (dark gray bars)-stimulated pDC-GEN2.2 cells after 8 hours of RNA stimulation. B) Dose-dependent response of viral replication control. CM from the HCV PAMP-stimulated pDC-GEN2.2 cells was added to JFH-1 infected cells at the following dilutions: 1∶1 (Dark gray bars), 1∶10 (gray bars) or 1∶100 (white bars). C) Type I IFN dependence was determined using the Vaccinia protein B18R which blocks Type I IFN responses. D) Blocking IL-28B/IL-29 (IFNλ3/IFNλ1) with a blocking, cross-reactive antibody demonstrates dependence on Type III IFNs for a portion of the viral control. E) Recombinant Type III Interferons in the absence of CM at the same concentrations as found in the CM (IL-28A/IFNλ2: 1500 pg/mL; IL-28B/IFNλ3: 10 pg/mL; IL-29/IFNλ1: 500 pg/mL) were added to JFH-1 infected Huh7.5.1 cells. Normalized HCV Copy Number is shown where the infection control condition HCV copy number is set to 1 (except panel A where the Mock condition is set to 1) and other conditions are expressed as normalized HCV copy number compared to infection control (or compared to Mock in panel A). Normalized HCV Copy Number = (Absolute copy number for condition/absolute copy number for infection control). Combined data from 3 (A, C and E), 5 (B, D) independent experiments p values represent the Mann-Whitney result of the comparison. * p<0.05 ** p<0.01 *** p<0.001 # p≤0.0001. Bars represent the mean and error bars are +/− SEM.
Figure 6
Figure 6. Co-culture of JFH-1-infected Huh7.5.1 cells and pDC-GEN2.2 cells leads to the upregulation of IFN genes and viral control.
A) Huh7.5.1 cells were infected for 24 hours with JFH-1 and then resting pDC-GEN2.2 cells were added for 24 hours. mRNA from the CD45+ cells was isolated and examined for IFN gene expression. Gene fold increase is shown for each gene after normalization to the reference gene GAPDH and the uninfected condition. B) Huh7.5.1 cells were infected for 24 hours with JFH-1 and then pDC-GEN2.2 cells that had been mock transfected, transfected with X-region RNA or pU/UC RNA for 8 hours were added for 4 days (5 days total infection). RNA was isolated and examined for JFH-1 copy number. Normalized HCV copy number is shown where the infection control condition HCV copy number is set to 1 and other conditions are expressed as normalized HCV copy number compared to infection control. Normalized HCV Copy Number = (Absolute copy number for condition/absolute copy number for infection control) p values represent the Mann-Whitney result of the comparison. * p<0.05 ** p<0.01 *** p<0.001 # p≤0.0001. Bars represent the mean and error bars are +/− SEM.
Figure 7
Figure 7. Ex vivo pDCs upregulate Type I and III Interferon genes in response to the HCV PAMP.
A) Gene expression changes in ex vivo pDCs after HCV PAMP RNA stimulation. Top: subjects with the CC IL28B/IFNλ3 genotype (2 subjects IL28A/IFNλ2, IL28B/IFNλ3, IL29/IFNλ1 and IFNβ1; 1 subject IFNα2; RIG-I SNPs GG and GA); middle: CT IL28B/IFNλ3 genotype (1 subject, RIG-I SNP AA); Bottom: TT IL28B/IFNλ3 genotype (1 subject RIG-I SNP GG). Top graph is combined data from 2 independent experiments while middle and bottom graphs are data from a single independent experiment each. B) Same gene expression data as in A graphed together. Compared to the non-CC genotypes, the CC subjects had significantly more IFN mRNA. p values are the Wilcoxon signed rank result for (A) each gene compared to the X-region stimulation (dashed line) from the same gene, and (B) each gene CC genotype compared to each gene non-CC genotype. * p<0.05 ** p<0.01 *** p<0.001 # p≤0.0001. Bars represent the mean and error bars are +/− SEM.

References

    1. Kato H, Sato S, Yoneyama M, Yamamoto M, Uematsu S, et al. (2005) Cell type-specific involvement of RIG-I in antiviral response. Immunity 23: 19–28. - PubMed
    1. Seth RB, Sun L, Chen ZJ (2006) Antiviral innate immunity pathways. Cell Research 16: 141–147. - PubMed
    1. Swiecki M, Wang Y, Vermi W, Gilfillan S, Schreiber RD, et al. (2011) Type I interferon negatively controls plasmacytoid dendritic cell numbers in vivo. J Exp Med 208: 2367–2374. - PMC - PubMed
    1. Swiecki M, Gilfillan S, Vermi W, Wang Y, Colonna M (2010) Plasmacytoid dendritic cell ablation impacts early interferon responses and antiviral NK and CD8(+) T cell accrual. Immunity 33: 955–966. - PMC - PubMed
    1. Takeuchi O, Akira S (2008) MDA5/RIG-I and virus recognition. Curr Opin Immunol 20: 17–22. - PubMed

Publication types