. 2013 Apr;9(4):e1003431.
doi: 10.1371/journal.pgen.1003431. Epub 2013 Apr 18.

Disruption of TTDA results in complete nucleotide excision repair deficiency and embryonic lethality

Affiliations

Disruption of TTDA results in complete nucleotide excision repair deficiency and embryonic lethality

Arjan F Theil et al. PLoS Genet. 2013 Apr.

Abstract

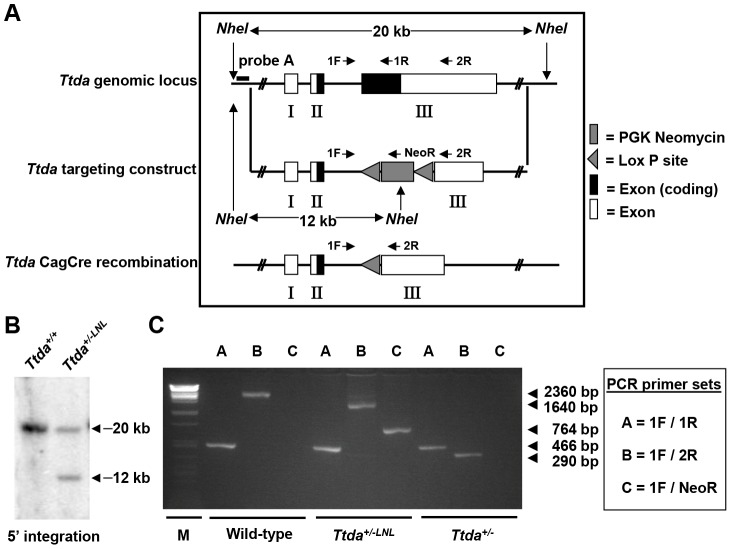
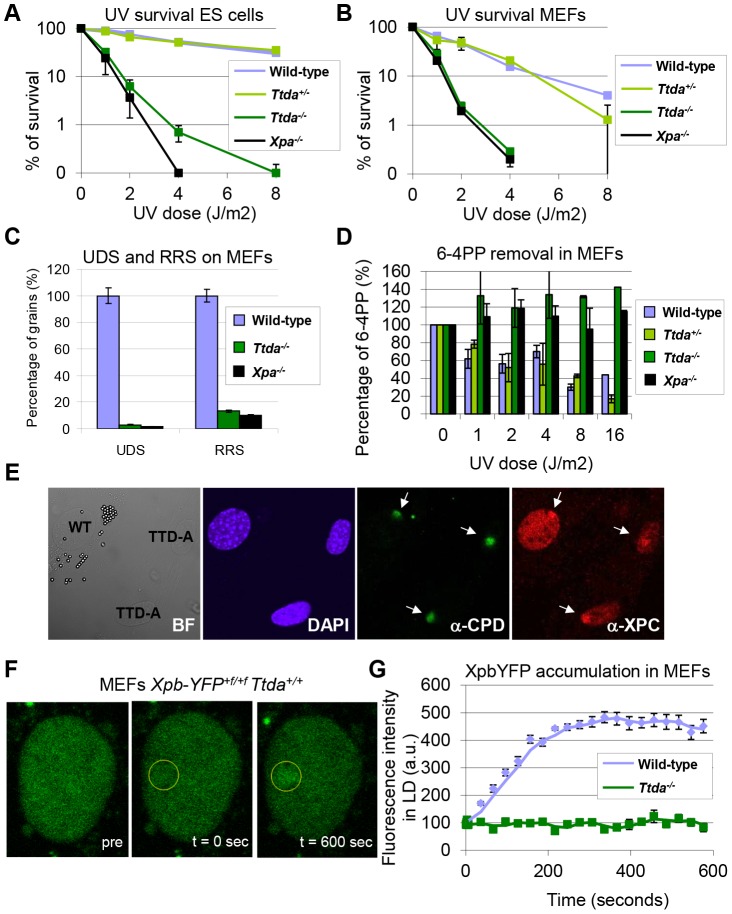
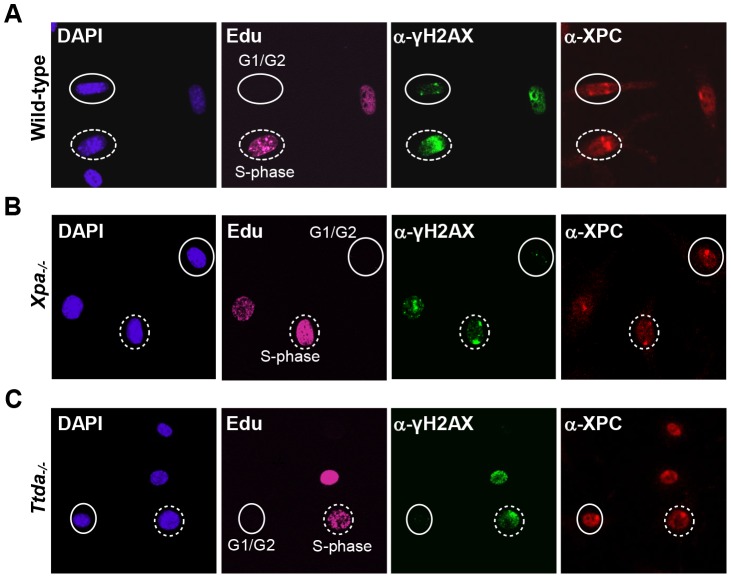
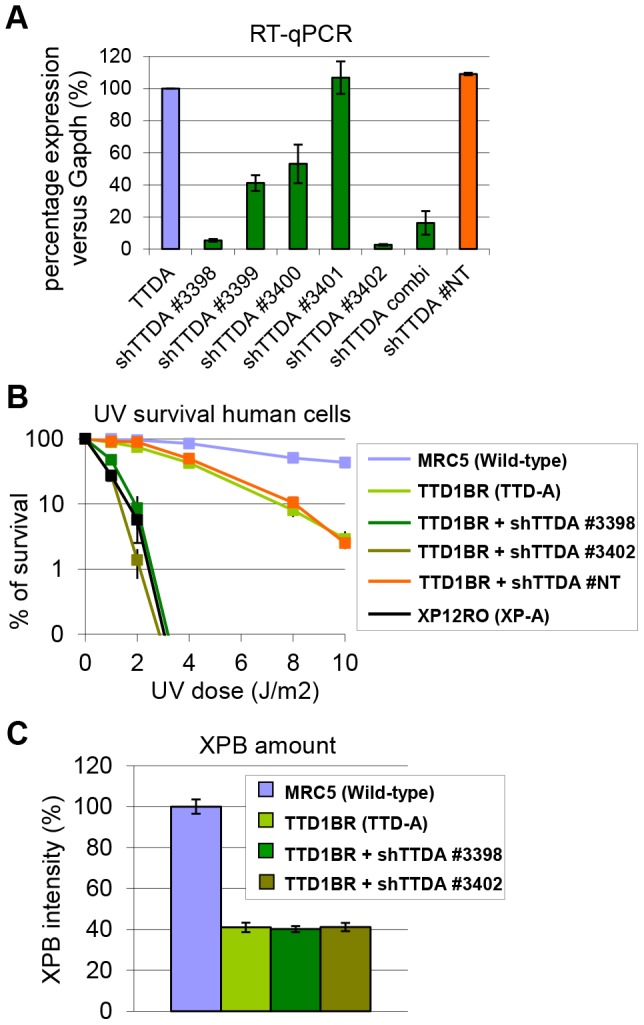
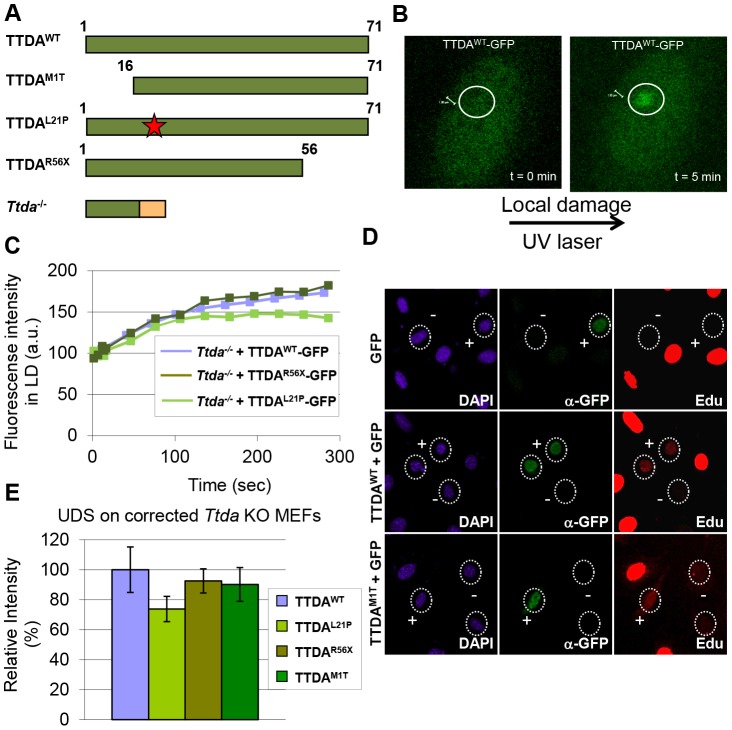
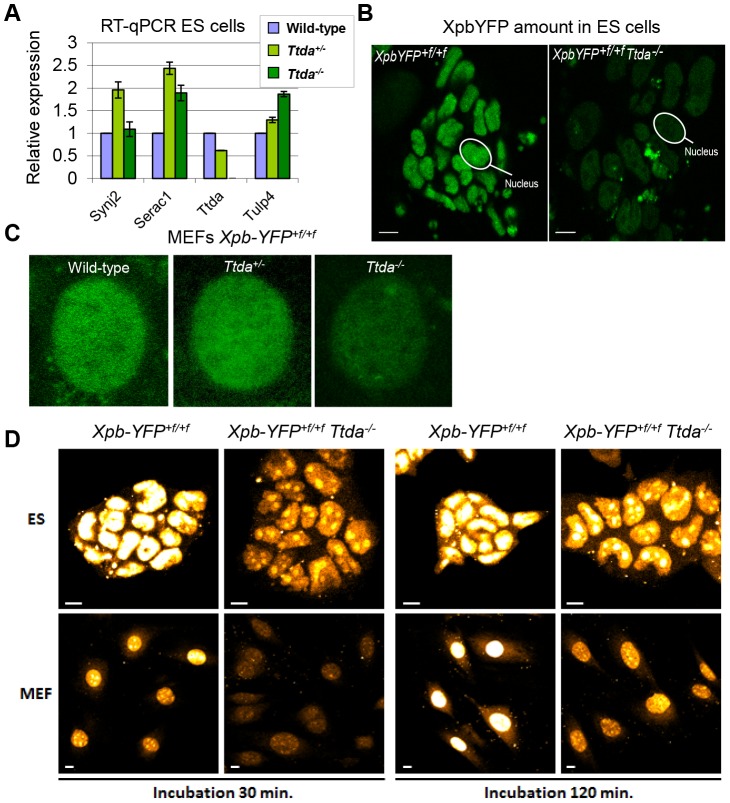
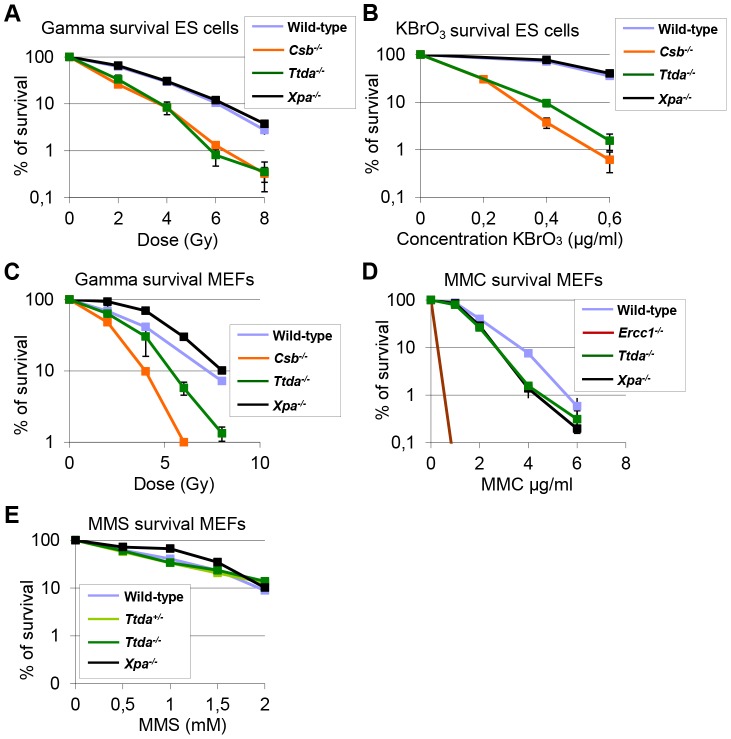
The ten-subunit transcription factor IIH (TFIIH) plays a crucial role in transcription and nucleotide excision repair (NER). Inactivating mutations in the smallest 8-kDa TFB5/TTDA subunit cause the neurodevelopmental progeroid repair syndrome trichothiodystrophy A (TTD-A). Previous studies have shown that TTDA is the only TFIIH subunit that appears not to be essential for NER, transcription, or viability. We studied the consequences of TTDA inactivation by generating a Ttda knock-out (Ttda(-/-) ) mouse-model resembling TTD-A patients. Unexpectedly, Ttda(-/-) mice were embryonic lethal. However, in contrast to full disruption of all other TFIIH subunits, viability of Ttda(-/-) cells was not affected. Surprisingly, Ttda(-/-) cells were completely NER deficient, contrary to the incomplete NER deficiency of TTD-A patient-derived cells. We further showed that TTD-A patient mutations only partially inactivate TTDA function, explaining the relatively mild repair phenotype of TTD-A cells. Moreover, Ttda(-/-) cells were also highly sensitive to oxidizing agents. These findings reveal an essential role of TTDA for life, nucleotide excision repair, and oxidative DNA damage repair and identify Ttda(-/-) cells as a unique class of TFIIH mutants.


Conflict of interest statement

The authors have declared that no competing interests exist.

Figures

Figure 1
Figure 1. Generation of Ttda knock-out mice.
(A) Schematic presentation of the mouse Ttda genomic locus, Ttda targeting construct and Ttda locus after CagCre recombination. Roman numbered boxes represent exons: white boxes are non-coding exon (parts) and black boxes are coding exon (parts). In the targeting construct LoxP sites are indicated with gray arrows and the dashed box represents the Neomycin selectable marker driven by a PGK promoter. The positions of NheI restriction sites, size of the NheI restriction fragments and the position of probe A used for DNA blot screening of digested ES cell DNA are indicated. The short arrows indicate the position and direction of primers used for genotyping. (B) DNA blot analysis of NheI-digested ES cell DNA using the probe A. (C) Genotype analysis with diagnostic PCR using primers 1F, 1R, 2R and NeoR in the different combinations (A, B and C).
Figure 2
Figure 2. Repair capacity of Ttda−/− cells.
(A) Colony forming ability after different doses of UV of wild-type, Ttda+/−. Ttda−/− and Xpa−/− ES cells. The percentage of surviving cells was plotted against the applied UV-dose, measured by counting surviving colonies of two independent experiments and at least 2 different clones per genotype. The error bars indicate the SEM. (B) Survival assay after different doses of UV of wild-type, Ttda+/−, Ttda−/− and Xpa−/− MEFs. The percentage of surviving cells was plotted against the applied UV-dose, measured by [3H]-thymidine incorporation of two independent experiments and at least 2 different clones per genotype. The error bars indicate the SEM. (C) DNA repair synthesis (UDS) and recovery of RNA synthesis (RRS) was measured by autoradiography. For the UDS assay, directly after exposure to 16 J/m2 UV-C MEFs were pulse labeled with medium containing [methyl-3H] Thymidine, washed with PBS and fixed. For the RRS assay, 16 hours after exposure to 16 J/m2 MEFs were pulse labeled with medium containing [3H] Uridine, washed with PBS and fixed. UDS and RRS are expressed as the percentage of autoradiographic grains above wild-type, which was set at 100%. (D) 6-4PP removal assayed by ELISA using a 6-4PP specific antibody of wild-type, Ttda+/−. Ttda−/− and Xpa−/− MEFs irradiated with 5 J/m2 (UV-light). DNA was isolated at different time-points after UV irradiation (0, 1, 2, 4, 8, and 16 hrs post UV). The amount of 6-4PP measured directly after UV was set at 100%. (E) Immuno-fluorescent analysis of XPC recruitment to local UV-damage in wild-type (labeled with 2 µm latex beads) and Ttda−/− MEFs. Cells were seeded in a 1∶1 ratio on cover slips and the next day irradiated with 60 J/m2 through a filter containing 5 µm pores. Cells were fixed 1 hour after UV and immuno-fluorescent staining was performed using antibodies against CPDs (damage marker, green) and XPC (green). (F) Representative series of confocal images of XpbYFP+f/+f MEFs before (left; pre), directly after (middle; t = 0 sec) and 600 seconds after (right; t = 600 sec) local UV-damage infliction, the yellow circle marks the area irradiated with the UV-laser. (G) Accumulation kinetics of XpbYFP to local UV-C (laser-induced) DNA damage in a wild-type and Ttda−/− background. Graphs represents the mean YFP-derived fluorescence intensity at the damaged spot at the indicated time points from approximately 12 cells.
Figure 3
Figure 3. γH2AX signaling is abolished in Ttda−/− MEFs.
Cell cycle dependent analysis of XPC and γH2AX recruitment to local UV-damage in wild-type (A), Xpa−/− (B) and Ttda−/− (C) MEFs. Cells were seeded on cover slips and the next day irradiated with 60 J/m2 through a filter containing 5 µm pores and subsequently labeled with EdU for 1 hour. After fixation cells were assayed for DNA synthesis using EdU and Alexa Fluor 647 azide (cell cycle marker, pink) and by immuno-fluorescent staining using antibodies against γH2AX (green) and XPC (red). Dashed circles indicate typical examples of cells in S-phase, closed circles indicate typical examples of G1/G2 cells.
Figure 4
Figure 4. Knock-down of mutant hTTDA results in complete NER deficiency.
(A) Relative expression levels of TTDA mRNA as determined by quantitative RT-PCR in TTD1BR-sv cells (TTD-A) and TTD1BR-sv cells stably expressing shRNAs for respectively: #non-targeting (NT), #3398, #3399, #3400, #3401 or #3402. The levels were normalized to Tubulin and the error bars indicate SEM between two independent experiments. (B) Colony forming ability after different doses of UV irradiation of MRC5-sv (wild-type), XP12RO-sv (XP-A), TTD1BR-sv and TTD1BR-sv cells stably expressing shRNA: #non-targeting (NT), #3398, #3399, #3400, #3401 and #3402. The percentage of surviving cells was plotted against the applied UV-dose, measured by counting surviving colonies of two independent experiments. The error bars indicate the SEM. (C) Quantitative immuno-fluorescence to determine the relative amount of XPB (TFIIH) in MRC5-sv (wild-type), TTD1BR-sv (TTD-A) and TTD1BR-sv cells stably expressing shRNA (#3398 or #3402). Confocal microscope pictures were used to quantify the average intensity of XBP and MDC1 (internal control) in >100 cells and error bars indicate SEM.
Figure 5
Figure 5. Mutant TTDA protein accumulation at local UV damage.
(A) Schematically representation of the predicted TTDA polypeptide length (in amino acids) in human wild-type cells (TTDAWT), TTD-A patient cells (TTDAM1T, TTDAL21P and TTDAR56X) and the Ttda knock-out cells (Ttda−/−). The red star represents the mutation found in TTDAL21P and the red part of the Ttda−/− bar represents intronic encoded non-sense amino acids. (B) Representative confocal images of Ttda−/− MEFs expressing TTDAWT-GFP before (t = 0 min) and after local UV-damage infliction (t = 5 min) in a selected area inside the nucleus (dashed circle). (C) Accumulation kinetics of TTDAWT-GFP, TTDAL21P-GFP and TTDAR56X-GFP to local UV-C (laser-induced) DNA damage expressed in Ttda−/− MEFs. Graphs represents the mean GFP-derived fluorescence intensity at the damaged spot at the indicated time points from approximately 12 cells. (D) Representative confocal microscope images of UV-induced UDS of Ttda−/− MEFs transiently co-transfected with an empty GFP vector (as a marker for transfected cells) in combination with a vector containing TTDAWT or TTDAM1T. Cells were seeded on cover slips and transfected 2 days before the experiment. Cells were irradiated with 16 J/m2 and subsequently labeled for 2 hours with EdU. Cells were fixed and stained for EdU incorporation (UDS and S-phase DNA synthesis, red) and GFP using antibodies against GFP (transfected cells, green). The intense red labeled cells are cells in S-phase. (E) The percentage of UDS signal in the nucleus was quantified by measuring the average fluorescence intensity from at least 25 cells positively transfected (containing GFP) and non-S-phase cells with TTDAWT, TTDAM1T, TTDAR56X or TTDAL21P. The error bars indicate the SEM.
Figure 6
Figure 6. Gene expression levels and TFIIH amount in Ttda−/− ES cells.
(A) Relative expression levels of mRNAs neighboring genes encoding Synaptojamin 2 (Synj2), Serine active site containing 1 (Serac1), Trichothiodystrophy group A (Ttda) and Tubby like protein 4 (Tulp4) in Ttda−/− (n = 2), Ttda+/− (n = 2) and wild-type (n = 2) ES cells as determined by quantitative RT-PCR. The levels were normalized to Gapdh and the error bars indicate SEM between experiments. (B) Representative confocal microscope pictures of XpbYFP+f/+f Ttda−/−, XpbYFP+f/+f Ttda+/− and XpbYFP+f/+f MEFs isolated from 10.5-day-old embryos. (C) Confocal images of ES cells isolated from XpbYFP+f/+f mouse model (left panel) and from XpbYFP+f/+f Ttda−/− mouse (right panel). The green signal is the direct fluorescence of the YFP tagged protein. The white bar measures 10 mm. (D) Confocal images of EU incorporation into ES cells isolated from XpbYFP+f/+f mouse model and from XpbYFP+f/+f Ttda−/− mouse (upper panel) and MEF's isolated from the same mouse models (lower panel). Two EU incubation times have been performed: 30 minutes (left panels) and 120 minutes (right panels). The white bar measures 10 mm.
Figure 7
Figure 7. Ttda−/− ES cells and MEFs exhibit oxidative DNA damage sensitivity.
(A) Colony forming ability after different doses of gamma irradiation of wild-type, Ttda−/−, Csb−/− and Xpa−/− ES cells. The percentage of surviving cells was plotted against the applied gamma-dose. (B) Colony forming ability after different concentrations of KBrO3 of wild-type, Ttda−/−, Csb−/− and Xpa−/− ES cells. The percentage of surviving cells was plotted against the applied gamma-dose. (C) Colony forming ability after different doses of gamma irradiation of wild-type, Ttda−/−, Csb−/− and Xpa−/− MEFs. The percentage of surviving cells was plotted against the applied gamma-dose. (D) Colony forming ability after different doses of 1 hour MMC treatment of wild-type, Ttda+/−, Ercc1−/− and Xpa−/− MEFs. The percentage of surviving cells was plotted against the applied gamma-dose. (E) Colony forming ability after different doses of 1 hour MMS treatment of wild-type, Ttda+/−, Ttda−/− and Xpa−/− MEFs. The percentage of surviving cells was plotted against the applied gamma-dose. For each survival plot (A–E) at least 2 different clones per genotype were measured in two independent experiments. The error bars indicate the SEM.

Similar articles

Cited by

References

    1. Hoeijmakers JH (2001) Genome maintenance mechanisms for preventing cancer. Nature 411: 366–374. - PubMed
    1. Sugasawa K, Akagi J, Nishi R, Iwai S, Hanaoka F (2009) Two-step recognition of DNA damage for mammalian nucleotide excision repair: Directional binding of the XPC complex and DNA strand scanning. Mol Cell 36: 642–653. - PubMed
    1. Conaway RC, Conaway JW (1993) General initiation factors for RNA polymerase II. Annu Rev Biochem 62: 161–190. - PubMed
    1. Egly JM (2001) The 14th Datta Lecture. TFIIH: from transcription to clinic. FEBS Lett 498: 124–128. - PubMed
    1. Zurita M, Merino C (2003) The transcriptional complexity of the TFIIH complex. Trends Genet 19: 578–584. - PubMed

Publication types

Substances