

All SNPs are not created equal: genome-wide association studies reveal a consistent pattern of enrichment among functionally annotated SNPs
- PMID: 23637621
- PMCID: PMC3636284
- DOI: 10.1371/journal.pgen.1003449
All SNPs are not created equal: genome-wide association studies reveal a consistent pattern of enrichment among functionally annotated SNPs
Abstract
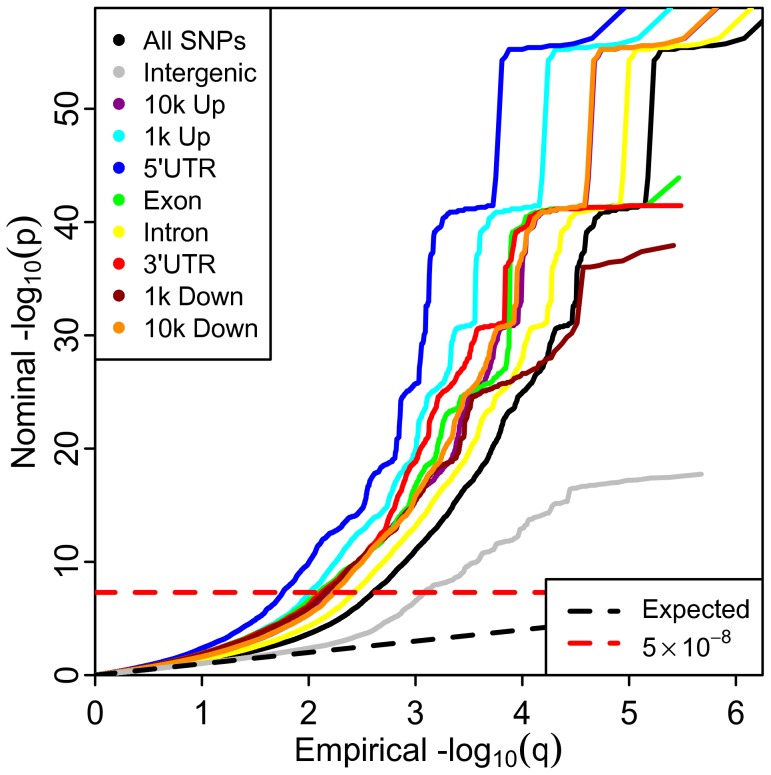
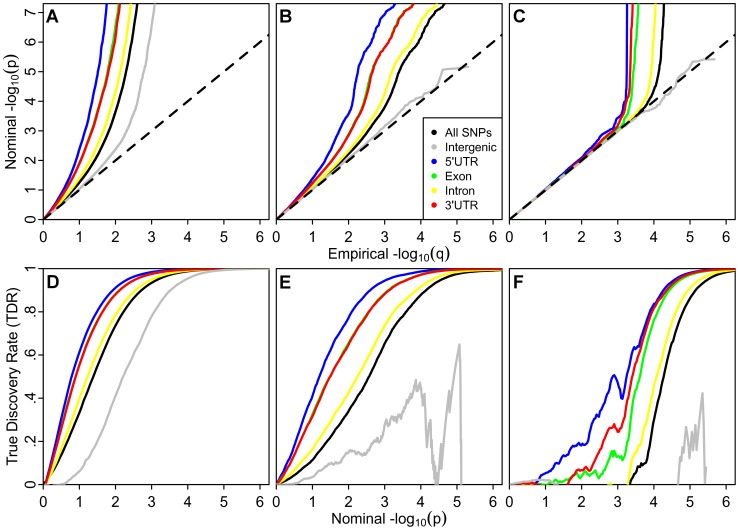
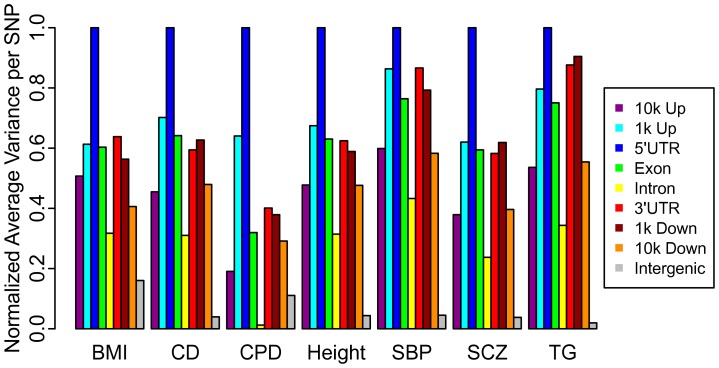
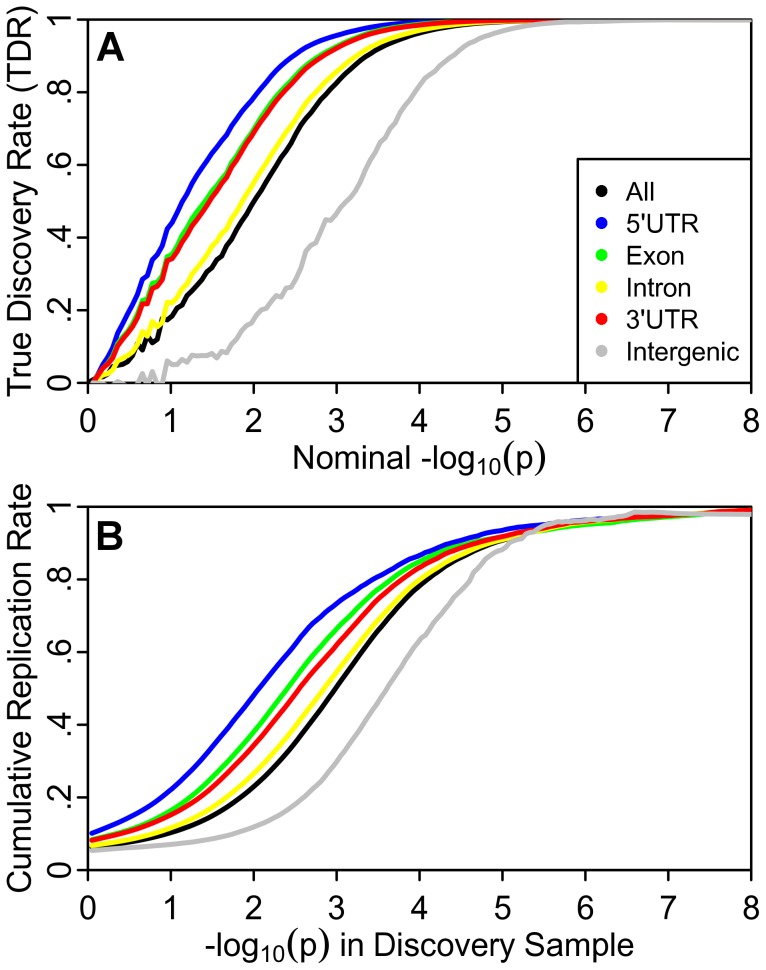
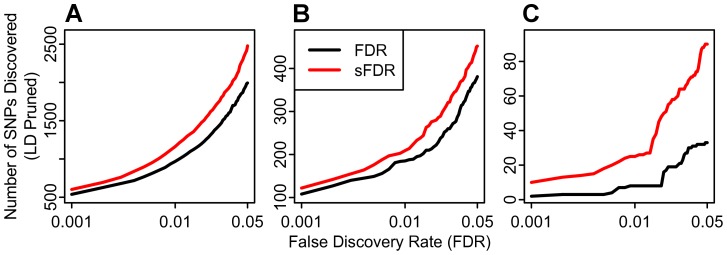
Recent results indicate that genome-wide association studies (GWAS) have the potential to explain much of the heritability of common complex phenotypes, but methods are lacking to reliably identify the remaining associated single nucleotide polymorphisms (SNPs). We applied stratified False Discovery Rate (sFDR) methods to leverage genic enrichment in GWAS summary statistics data to uncover new loci likely to replicate in independent samples. Specifically, we use linkage disequilibrium-weighted annotations for each SNP in combination with nominal p-values to estimate the True Discovery Rate (TDR = 1-FDR) for strata determined by different genic categories. We show a consistent pattern of enrichment of polygenic effects in specific annotation categories across diverse phenotypes, with the greatest enrichment for SNPs tagging regulatory and coding genic elements, little enrichment in introns, and negative enrichment for intergenic SNPs. Stratified enrichment directly leads to increased TDR for a given p-value, mirrored by increased replication rates in independent samples. We show this in independent Crohn's disease GWAS, where we find a hundredfold variation in replication rate across genic categories. Applying a well-established sFDR methodology we demonstrate the utility of stratification for improving power of GWAS in complex phenotypes, with increased rejection rates from 20% in height to 300% in schizophrenia with traditional FDR and sFDR both fixed at 0.05. Our analyses demonstrate an inherent stratification among GWAS SNPs with important conceptual implications that can be leveraged by statistical methods to improve the discovery of loci.
Conflict of interest statement
The authors have declared that no competing interests exist.
Figures
References
Publication types
MeSH terms
Grants and funding
- R01EB000790/EB/NIBIB NIH HHS/United States
- R01 AG031224/AG/NIA NIH HHS/United States
- SR01AG022381-09/AG/NIA NIH HHS/United States
- R01 EB000790/EB/NIBIB NIH HHS/United States
- UL1 RR025774/RR/NCRR NIH HHS/United States
- R01AG031224/AG/NIA NIH HHS/United States
- R01AG022381/AG/NIA NIH HHS/United States
- P50MH081755/MH/NIMH NIH HHS/United States
- P50NS022343/NS/NINDS NIH HHS/United States
- P50 MH081755/MH/NIMH NIH HHS/United States
- R01 MH083094/MH/NIMH NIH HHS/United States
- R01 HD061414/HD/NICHD NIH HHS/United States
- R01HD061414/HD/NICHD NIH HHS/United States
- G1000708/MRC_/Medical Research Council/United Kingdom
- P50 NS022343/NS/NINDS NIH HHS/United States
- U19 AG023122/AG/NIA NIH HHS/United States
- U54 NS056883/NS/NINDS NIH HHS/United States
- U54NS056883/NS/NINDS NIH HHS/United States
- 090532/WT_/Wellcome Trust/United Kingdom
- G0701420/MRC_/Medical Research Council/United Kingdom
- RC2 DA029475/DA/NIDA NIH HHS/United States
- RC2DA029475/DA/NIDA NIH HHS/United States
- R01 AG022381/AG/NIA NIH HHS/United States
LinkOut - more resources
Full Text Sources
Other Literature Sources
