. 2013 Apr;9(4):e1003455.
doi: 10.1371/journal.pgen.1003455. Epub 2013 Apr 25.

Improved detection of common variants associated with schizophrenia and bipolar disorder using pleiotropy-informed conditional false discovery rate

Affiliations

Improved detection of common variants associated with schizophrenia and bipolar disorder using pleiotropy-informed conditional false discovery rate

Ole A Andreassen et al. PLoS Genet. 2013 Apr.

Erratum in

Abstract

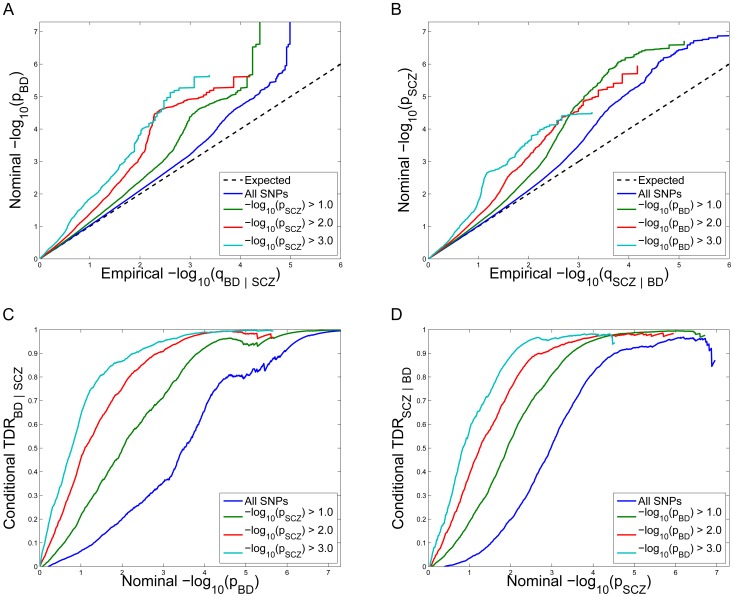
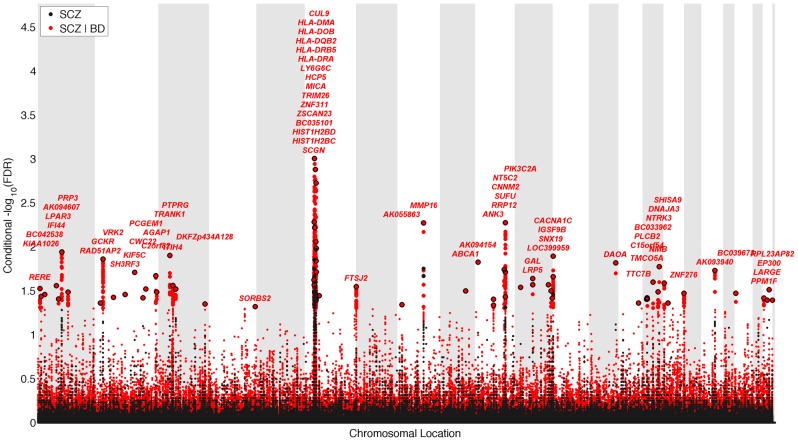
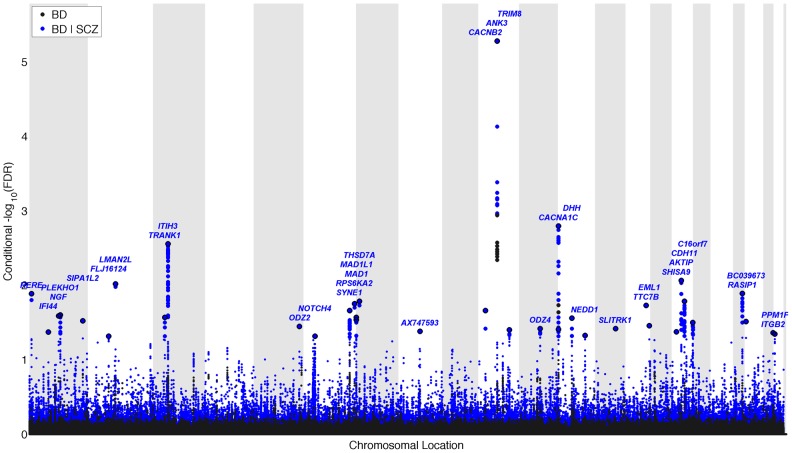
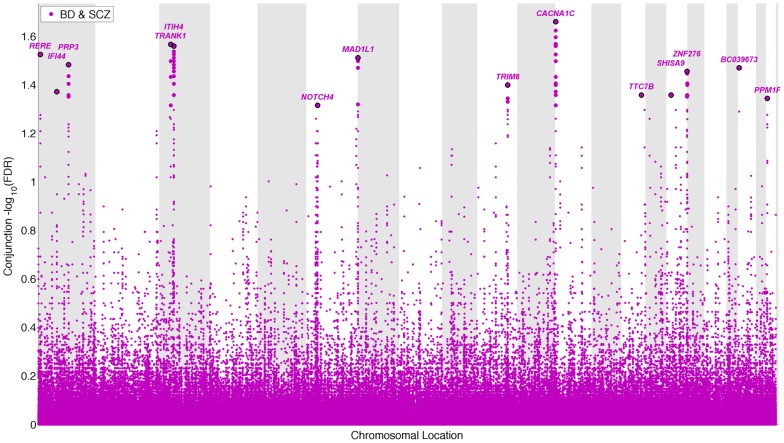
Several lines of evidence suggest that genome-wide association studies (GWAS) have the potential to explain more of the "missing heritability" of common complex phenotypes. However, reliable methods to identify a larger proportion of single nucleotide polymorphisms (SNPs) that impact disease risk are currently lacking. Here, we use a genetic pleiotropy-informed conditional false discovery rate (FDR) method on GWAS summary statistics data to identify new loci associated with schizophrenia (SCZ) and bipolar disorders (BD), two highly heritable disorders with significant missing heritability. Epidemiological and clinical evidence suggest similar disease characteristics and overlapping genes between SCZ and BD. Here, we computed conditional Q-Q curves of data from the Psychiatric Genome Consortium (SCZ; n = 9,379 cases and n = 7,736 controls; BD: n = 6,990 cases and n = 4,820 controls) to show enrichment of SNPs associated with SCZ as a function of association with BD and vice versa with a corresponding reduction in FDR. Applying the conditional FDR method, we identified 58 loci associated with SCZ and 35 loci associated with BD below the conditional FDR level of 0.05. Of these, 14 loci were associated with both SCZ and BD (conjunction FDR). Together, these findings show the feasibility of genetic pleiotropy-informed methods to improve gene discovery in SCZ and BD and indicate overlapping genetic mechanisms between these two disorders.


Conflict of interest statement

The authors have declared that no competing interests exist.

Figures

Figure 1
Figure 1. Stratified Q–Q plot and Stratified True Discovery Rate plots.
Upper panel: Stratified Q-Q plot of nominal versus empirical −log10 p-values (corrected for inflation) in A) schizophrenia (SCZ) below the standard GWAS threshold of p<5×10⁻⁸ as a function of significance of the association with bipolar disorder (BD) at the level of −log10(p)>0, −log10(p)>1, −log10(p)>2, −log10(p)>3 corresponding to p<1, p<0.1, p<0.01, p<0.001, respectively, and in B) BD below the standard GWAS threshold of p<5×10⁻⁸ as a function of significance of association with SCZ at the level of −log10(p)>0, −log10(p)>1, −log10(p)>2, −log10(p)>3 corresponding to p<1, p<0.1, p<0.01, p<0.001, respectively. Dotted lines indicate the null-hypothesis. Lower panel: Stratified True Discovery Rate (TDR) plots illustrating the increase in TDR associated with increased pleiotropic enrichment in C) SCZ conditional on nominal BD p-values (SCZ|BD), and D) BD conditional on nominal SCZ p-values (BD|SCZ). For more information about QQ plots, see Text S1.
Figure 2
Figure 2. “Conditional Manhattan plot” of conditional −log10 (FDR) values for schizophrenia (SCZ) alone (black) and SCZ given bipolar disorder (BD; SCZ|BD, red).
SNPs with conditional −log10 FDR>1.3 (i.e. FDR<0.05) are shown with large points. A black line around the large points indicates the most significant SNP in each LD block and this SNP was annotated with the closest gene, which is listed above the symbols in each locus. The figure shows the localization of significant loci. Details about the loci are provided in Table 1.
Figure 3
Figure 3. “Conditional Manhattan plot” of conditional −log10 (FDR) values for Bipolar disorder (BD) alone (black) and BD given schizophrenia (SCZ; BD|SCZ, blue).
SNPs with conditional −log10 FDR>1.3 (i.e. FDR<0.05) are shown with large points. A black line around the large points indicates the most significant SNP in each LD block and this SNP was annotated with the closest gene, which is listed above the symbols in each locus. The figure shows the localization of significant loci. Details about the loci are provided in Table 2.
Figure 4
Figure 4. “Conjunction Manhattan plot” of conjunction −log10 (FDR) values for schizophrenia (SCZ) and bipolar disorder (BD).
SNPs with −log10 (FDR)>1.3, (i.e. FDR<0.05) for both SCZ and BD are shown with large points. A black line around the large points indicates the most significant SNP in each LD block and this SNP was annotated with the closest gene, which is listed above the symbols in each chromosome. The figure shows the localization of the ‘pleiotropic loci’, and further details are provided in Table 3.
Figure 5
Figure 5. Histograms of absolute z-scores for bipolar disorder (BD, top panels) and schizophrenia (SCZ, bottom panels) for z-scores ≥3.
Left panels are actual data, whereas right panels are hypothetical realizations from a doubling of effective sample size, generated from mixture model fits of f(z) = π0f0(z)+(1−π0)f1(z) (see Text S1). Black lines are null sub-densities π0f0(z) and red lines are the full mixture densities f(z). The local false discovery rate is the ratio fdr = π0f0(z)/f(z). Vertical black bars in each plot indicate the cut-points where local fdr≤0.05.
Figure 6
Figure 6. ROC curves for bipolar disorder (top) and schizophrenia (bottom).
Solid black line show the proportion of non-null SNPs declared significant (sensitivity) for a given local false discovery rate (1-specificity). The corresponding ROC curves for bipolar disorder local FDR conditional on schizophrenia (top) and schizophrenia local FDR conditional on bipolar disorder (bottom) are given in red. Power resulting from a hypothetical doubling of effective subject sample size is given by the dashed black lines.

References

    1. Glazier AM, Nadeau JH, Aitman TJ (2002) Finding genes that underlie complex traits. Science 298: 2345–2349. - PubMed
    1. Hindorff LA, Sethupathy P, Junkins HA, Ramos EM, Mehta JP, et al. (2009) Potential etiologic and functional implications of genome-wide association loci for human diseases and traits. Proc Natl Acad Sci U S A 106: 9362–9367. - PMC - PubMed
    1. Hirschhorn JN, Daly MJ (2005) Genome-wide association studies for common diseases and complex traits. Nat Rev Genet 6: 95–108. - PubMed
    1. Yang J, Manolio TA, Pasquale LR, Boerwinkle E, Caporaso N, et al. (2011) Genome partitioning of genetic variation for complex traits using common SNPs. Nat Genet 43: 519–525. - PMC - PubMed
    1. Yoo YJ, Pinnaduwage D, Waggott D, Bull SB, Sun L (2009) Genome-wide association analyses of North American Rheumatoid Arthritis Consortium and Framingham Heart Study data utilizing genome-wide linkage results. BMC Proc 3 Suppl 7: S103. - PMC - PubMed

Publication types

MeSH terms