. 2013 Apr;9(4):e1003485.
doi: 10.1371/journal.pgen.1003485. Epub 2013 Apr 25.

The genome organization of Thermotoga maritima reflects its lifestyle

Affiliations

The genome organization of Thermotoga maritima reflects its lifestyle

Haythem Latif et al. PLoS Genet. 2013 Apr.

Abstract

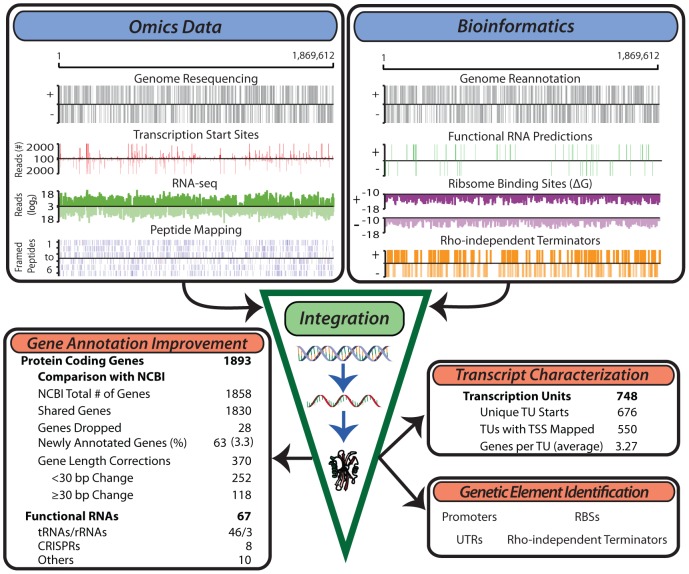
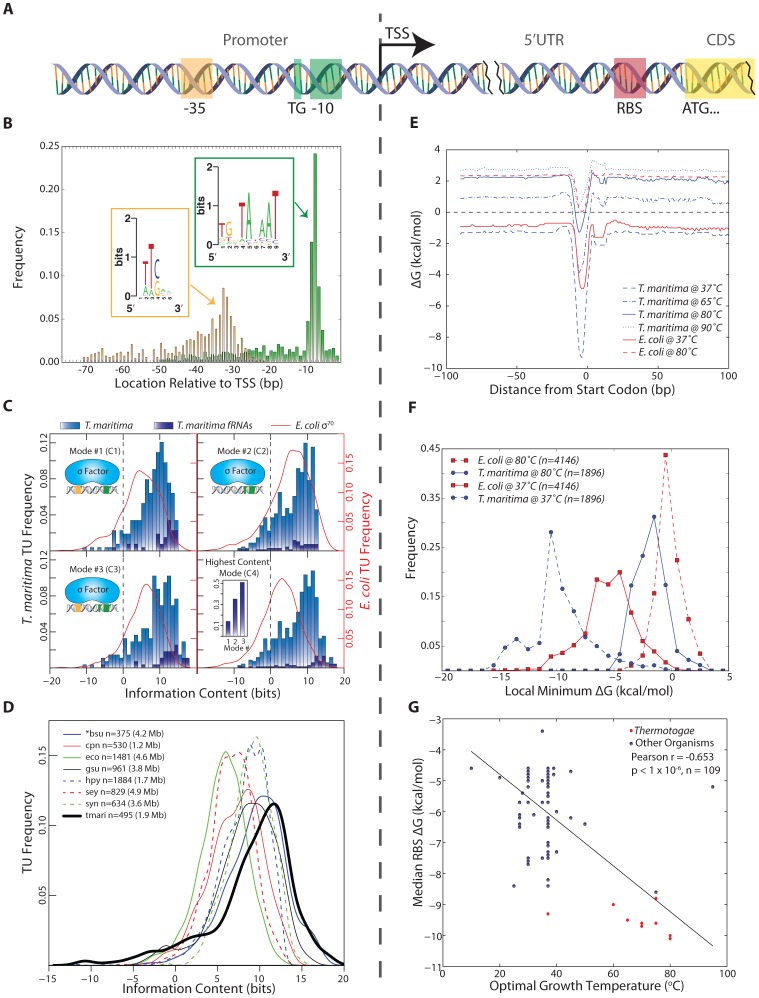
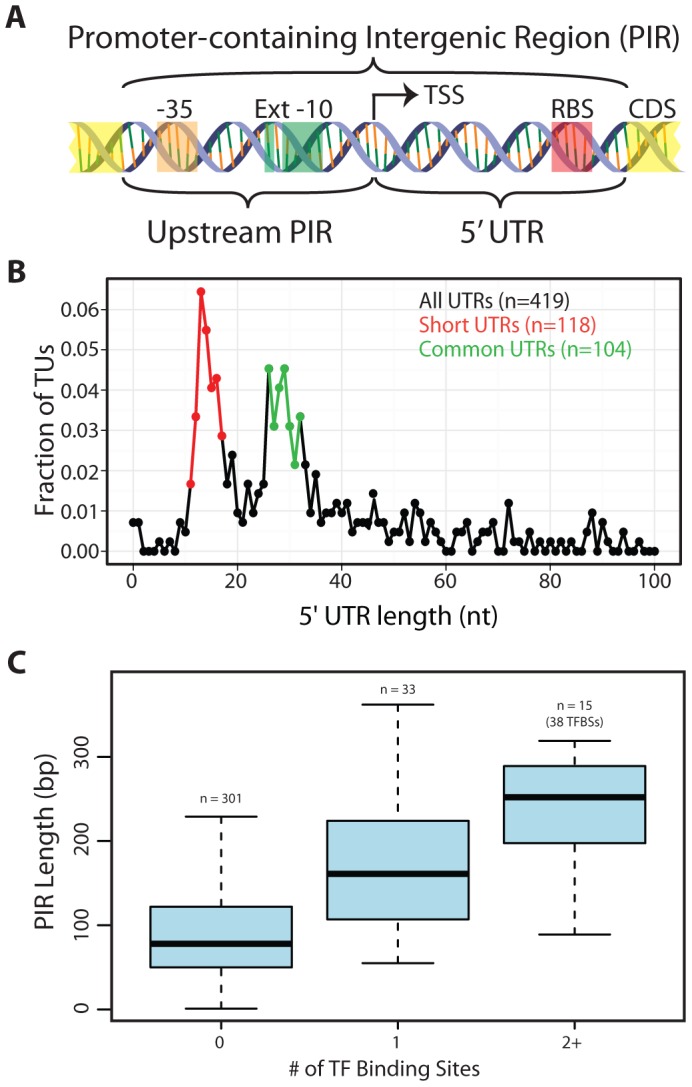
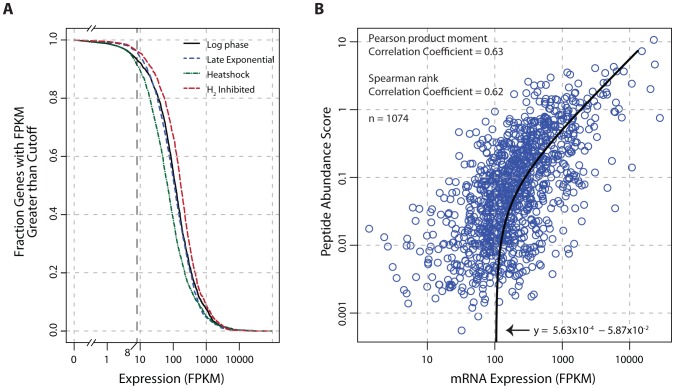
The generation of genome-scale data is becoming more routine, yet the subsequent analysis of omics data remains a significant challenge. Here, an approach that integrates multiple omics datasets with bioinformatics tools was developed that produces a detailed annotation of several microbial genomic features. This methodology was used to characterize the genome of Thermotoga maritima--a phylogenetically deep-branching, hyperthermophilic bacterium. Experimental data were generated for whole-genome resequencing, transcription start site (TSS) determination, transcriptome profiling, and proteome profiling. These datasets, analyzed in combination with bioinformatics tools, served as a basis for the improvement of gene annotation, the elucidation of transcription units (TUs), the identification of putative non-coding RNAs (ncRNAs), and the determination of promoters and ribosome binding sites. This revealed many distinctive properties of the T. maritima genome organization relative to other bacteria. This genome has a high number of genes per TU (3.3), a paucity of putative ncRNAs (12), and few TUs with multiple TSSs (3.7%). Quantitative analysis of promoters and ribosome binding sites showed increased sequence conservation relative to other bacteria. The 5'UTRs follow an atypical bimodal length distribution comprised of "Short" 5'UTRs (11-17 nt) and "Common" 5'UTRs (26-32 nt). Transcriptional regulation is limited by a lack of intergenic space for the majority of TUs. Lastly, a high fraction of annotated genes are expressed independent of growth state and a linear correlation of mRNA/protein is observed (Pearson r = 0.63, p<2.2 × 10(-16) t-test). These distinctive properties are hypothesized to be a reflection of this organism's hyperthermophilic lifestyle and could yield novel insights into the evolutionary trajectory of microbial life on earth.


Conflict of interest statement

The authors have declared that no competing interests exist.

Figures

Figure 1
Figure 1. Generation of multiple genome-scale datasets integrated with bioinformatics predictions reveals the genome organization.
Experimental data generated for the study of the T. maritima genome include genome resequencing, TSS determination, RNA-seq, tiling arrays (not shown) and LC-MS/MS peptide mapping (top left). Bioinformatics approaches used include genome re-annotation, functional RNA prediction, ribosome binding site energy calculations, and determination of intrinsic terminators (top right). Integration of these distinct datasets involves normalization and quantification to genomic coordinates. This experimentally anchors gene annotation improvements, defines the TU architecture, identifies non-coding RNAs and serves as a basis for the identification of additional genetic elements such as promoters and ribosome binding sites.
Figure 2
Figure 2. Identification and quantitative comparison of genetic elements for transcription and translation initiation.
(A) Schematic showing the position of the promoter upstream of the TSS and the RBS upstream of the translation start codon. (B) The genomic position of the 3′ end of each promoter element is shown relative to the TSS for all T. maritima TUs. Promoter elements were identified using a gapped motif search for a −35 hexamer and a −10 nonamer. This revealed an E. coli σ70 promoter architecture for the housekeeping sigma factor of T. maritima, RpoD. The motif for both promoter elements is displayed as a sequence logo (insets). (C) The relative binding free energy of σ70 is captured using information content. Each panel shows the distribution of promoter information content for T. maritima and E. coli. Mode 1 (C1) calculates information content based on σ70 contacts with the −35 and −10 hexamer promoter elements (ntmari = 265, ntmari_fRNA = 38, neco = 650). Mode 2 (C2) represents binding to the extended −10 promoter (ntmari = 676, ntmari_fRNA = 57, neco = 1,481). Mode 3 (C3) represents σ70-binding to both the −35 and the extended −10 promoter elements (ntmari = 274, ntmari_fRNA = 37, neco = 657). (C4) shows the distribution of information content for all promoters when only the highest scoring mode is considered (ntmari = 676, ntmari_fRNA = 57, neco = 1,481). The inset shows the highest distribution of functional RNAs across the modes. (D) The σ70 binding modes from (C) were used to calculate the promoter information content for seven additional bacterial species. Analogous to (C4), the distribution of information scores when only the highest bit score mode is considered is shown. The organism abbreviations correspond to the following: bsu, Bacillus subtilis; cpn, Chlamydophila pneumoniae CWL029; eco, Escherichia coli K12 MG1655; gsu, Geobacter sulfurreducens PCA; hpy, Helicobacter pylori 26695; sey, Salmonella enterica subsp. enterica serovar Typhimurium SL1344; syn, Synechocystis sp. PCC 6803; tmari, T. maritima MSB8. The genome size is given in paranthesis. *bsu data is extracted from a highly curated source that is a collection of small-scale experiments and, as such, this distribution is not a genome-scale assessment of promoter strength. (E) The calculated median RBS ΔG for all genes based on the position relative to the start codon. Temperature profiles are shown for T. maritima at 37°C (for comparison), 65°C (lower growth limit), 80°C (growth optimum) and 90°C (upper growth limit). Similar profiles are shown for E. coli at 37°C (optimal) and 80°C (for comparison). (F) The local minimum RBS ΔG for all genes in a 30 nt window upstream of the annotated start codon generated for T. maritima and E. coli at 37°C and 80°C. (G) Similar to (F), the median of the local minimum RBS ΔG was calculated and plotted for 109 bacteria against their optimal growth temperature. Species in the Thermotogae phylum (n = 15) are shown in red.
Figure 3
Figure 3. Arrangement of genomic features contained within promoter-containing intergenic regions (PIRs).
(A) Schematic of the two subdivisions of the PIR and the genetic elements they typically carry. (B) The 5′UTR distribution is shown for all TUs with an experimentally identified TSS. The Short 5′UTR group (11–17 nt) is shown in red. The Common 5′UTR group (26–32 nt) is shown in green. Transcripts with an annotated functional RNA as the first feature were omitted from the analysis. Though only the first 100 nt are plotted, frequencies are based on the entire set of 5′UTR lengths. (C) A quartile plot of the length distribution of PIRs is shown. PIRs are grouped according to the number of TF binding sites they contain (no TF, a single TF or multiple TFs).
Figure 4
Figure 4. Global analysis of mRNA and protein expression levels.
(A) The fraction of transcribed genes as a function of the FPKM threshold. Under growth promoting conditions (log-phase) and early in the transition to stressed conditions (carbon-limited late exponential phase, heat shock, and hydrogen inhibition), 91–96% of the genome is expressed using a conservative FPKM threshold of ≥8. (B) Correlation of mRNA expression and protein abundance. The line of best fit indicates a strong linear relationship (Pearson r = 0.63, p<2.2×10⁻¹⁶ t-test) between transcription and translation. The peptide abundance score for each protein was derived by dividing the total spectral count by the number of possible tryptic peptides (400–2000 m/z up to a charge state (z) of 3, hence a maximum fragment mass of 6000). Abbreviations: FPKM, Fragments Per Kilobase of transcript per Million mapped reads; m/z, mass-to-charge ratio.

References

    1. Kitano H (2002) Systems biology: a brief overview. Science 295: 1662–1664. - PubMed
    1. Feist AM, Herrgard MJ, Thiele I, Reed JL, Palsson BO (2009) Reconstruction of biochemical networks in microorganisms. Nat Rev Microbiol 7: 129–143. - PMC - PubMed
    1. Reed JL, Famili I, Thiele I, Palsson BO (2006) Towards multidimensional genome annotation. Nat Rev Genet 7: 130–141. - PubMed
    1. Overbeek R, Bartels D, Vonstein V, Meyer F (2007) Annotation of bacterial and archaeal genomes: improving accuracy and consistency. Chem Rev 107: 3431–3447. - PubMed
    1. Guell M, van Noort V, Yus E, Chen WH, Leigh-Bell J, et al. (2009) Transcriptome complexity in a genome-reduced bacterium. Science 326: 1268–1271. - PubMed

Publication types

Substances

Associated data