. 2013 Apr 23;8(4):e61134.
doi: 10.1371/journal.pone.0061134. Print 2013.

From data towards knowledge: revealing the architecture of signaling systems by unifying knowledge mining and data mining of systematic perturbation data

Affiliations

From data towards knowledge: revealing the architecture of signaling systems by unifying knowledge mining and data mining of systematic perturbation data

Songjian Lu et al. PLoS One. .

Abstract

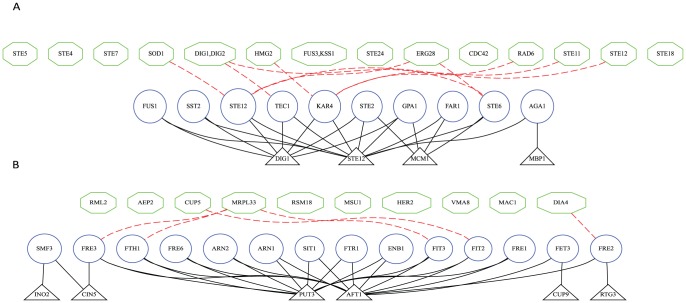
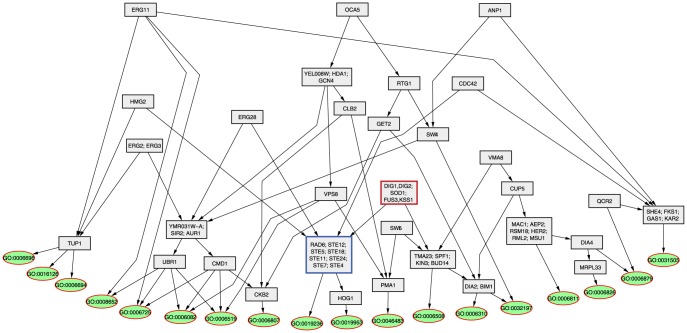
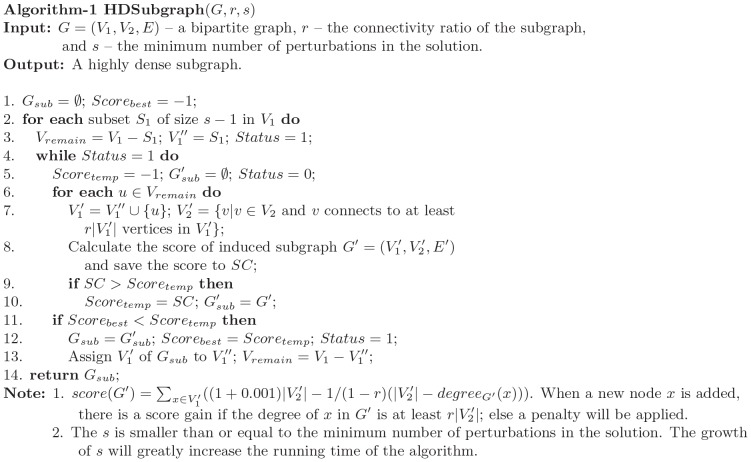
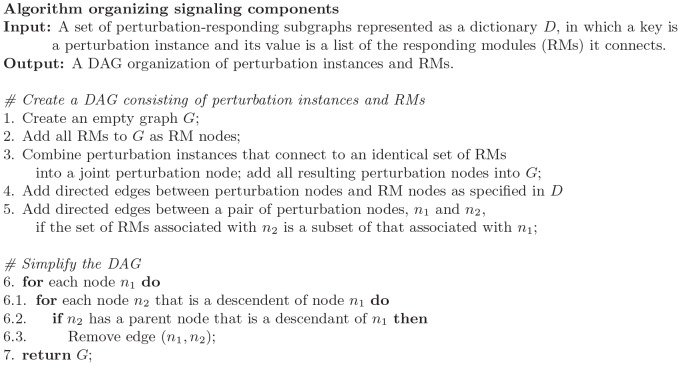
Genetic and pharmacological perturbation experiments, such as deleting a gene and monitoring gene expression responses, are powerful tools for studying cellular signal transduction pathways. However, it remains a challenge to automatically derive knowledge of a cellular signaling system at a conceptual level from systematic perturbation-response data. In this study, we explored a framework that unifies knowledge mining and data mining towards the goal. The framework consists of the following automated processes: 1) applying an ontology-driven knowledge mining approach to identify functional modules among the genes responding to a perturbation in order to reveal potential signals affected by the perturbation; 2) applying a graph-based data mining approach to search for perturbations that affect a common signal; and 3) revealing the architecture of a signaling system by organizing signaling units into a hierarchy based on their relationships. Applying this framework to a compendium of yeast perturbation-response data, we have successfully recovered many well-known signal transduction pathways; in addition, our analysis has led to many new hypotheses regarding the yeast signal transduction system; finally, our analysis automatically organized perturbed genes as a graph reflecting the architecture of the yeast signaling system. Importantly, this framework transformed molecular findings from a gene level to a conceptual level, which can be readily translated into computable knowledge in the form of rules regarding the yeast signaling system, such as "if genes involved in the MAPK signaling are perturbed, genes involved in pheromone responses will be differentially expressed."


Conflict of interest statement

Competing Interests: The authors have declared that no competing interests exist.

Figures

Figure 1
Figure 1. Characterization of the summary GO terms.
A. The histograms of the number of genes associated with each GO term before and after ontology-guided knowledge mining: 1) the original GO annotations for all responding genes (blue); and 2) the GO terms returned by the instance-based module search (red). B. The distribution of the levels of the above GO term sets in the ontology hierarchy are shown as normalized histograms. Level formula image represents the root of the Biological Process namespace.
Figure 2
Figure 2. Functional coherence of modules.
A. The cumulative distribution of functional coherence p-values of the responding modules identified by different methods: MBSEC with module-based input graphs (red); SAMBA with module-based input graphs (green); and SAMBA with the global input graph (blue). B. The cumulative distribution of functional coherence p-values of the perturbation modules identified by different methods: MBSEC with module-based input graphs (red); SAMBA with module-based input graphs (green); and SAMBA with the global input graph (blue).
Figure 3
Figure 3. Subgraph connectivity.
Cumulative distribution of within bipartite subgraph connectivity of the modules identified in three experiments: MBSEC with module-based input graphs (red); SAMBA with module-based input graphs (green); and SAMBA with global input graph (blue).
Figure 4
Figure 4. Protein-protein physical and genetic interactions within modules.
A. The cumulative distribution of the within module PPI/GI connectivity ratios of responding modules identified by different methods: MBSEC with module-based input graphs (red); SAMBA with module-based input graphs (green); and SAMBA with the global input graph (blue). B. The cumulative distribution of the connectivity ratios within perturbation modules identified by different methods: MBSEC with module-based input graphs (red); SAMBA with module-based input graphs (green); and SAMBA with the global input graph (blue).
Figure 5
Figure 5. Example perturbation-responding subgraphs.
Two example subgraphs are shown: Panel A, GO:0019236 (response to pheromone) and Panel B, GO:0006826 (iron ion transport). For each subgraph, the perturbation instances (green hexagons) are shown in the top tier; responding genes (blue circles) are shown in the middle tiers; and the transcription factor modules (grey triangles) are shown in the bottom tier. To avoid an overly crowded figure, a red dash line indicates that a perturbation instance and a responding gene are NOT connected.
Figure 6
Figure 6. Organizing perturbation instances and responding modules.
In this graph, responding modules are represented as green oval nodes, with each being annotated by a GO term. The rectangle nodes are perturbation nodes, which may contain one or more genes that share a common set of responding modules.
Figure 7
Figure 7. Greedy algorithm to find the highly dense bipartite subgraph.
Figure 8
Figure 8. Algorithm for organizing perturbation instances and RMs.

References

    1. Cover TM, Thomas JA (2006) Elements of Information Theory. 2nd Ed., John Wiley and Sons.
    1. Gustin MC, Albertyn J, Alexander M, Davenport K (1998) MAP Kinase Pathway in the Yeast Saccharomyces cerevisiae. Microbilogy and Molecular Biology Reviews 62: 1264–1300. - PMC - PubMed
    1. Herskowitz I (1995) MAP kinase pathways in yeast: For mating and more. Cell 80: 187–197. - PubMed
    1. Hughes TR, Marton MJ, Jones AR, Roberts CJ, Stoughton R, et al. (2000) Functional Discovery via a Compendium of Expression Profiles. Cell 102: 109–126. - PubMed
    1. Huang SC, Fraenkel E (2009) Integrating Proteomic and Transcriptional and Interactome Data Reveals Hidden Components of signaling and Regulatory Networks. Science Signaling 2: Ra40. - PMC - PubMed

Publication types

MeSH terms

Substances