. 2013 Apr 24;8(4):e61373.
doi: 10.1371/journal.pone.0061373. Print 2013.

Assessing the online social environment for surveillance of obesity prevalence

Affiliations

Assessing the online social environment for surveillance of obesity prevalence

Rumi Chunara et al. PLoS One. .

Abstract

Background: Understanding the social environmental around obesity has been limited by available data. One promising approach used to bridge similar gaps elsewhere is to use passively generated digital data.

Purpose: This article explores the relationship between online social environment via web-based social networks and population obesity prevalence.

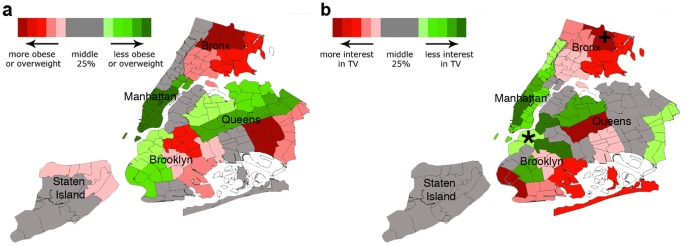
Methods: We performed a cross-sectional study using linear regression and cross validation to measure the relationship and predictive performance of user interests on the online social network Facebook to obesity prevalence in metros across the United States of America (USA) and neighborhoods within New York City (NYC). The outcomes, proportion of obese and/or overweight population in USA metros and NYC neighborhoods, were obtained via the Centers for Disease Control and Prevention Behavioral Risk Factor Surveillance and NYC EpiQuery systems. Predictors were geographically specific proportion of users with activity-related and sedentary-related interests on Facebook.

Results: Higher proportion of the population with activity-related interests on Facebook was associated with a significant 12.0% (95% Confidence Interval (CI) 11.9 to 12.1) lower predicted prevalence of obese and/or overweight people across USA metros and 7.2% (95% CI: 6.8 to 7.7) across NYC neighborhoods. Conversely, greater proportion of the population with interest in television was associated with higher prevalence of obese and/or overweight people of 3.9% (95% CI: 3.7 to 4.0) (USA) and 27.5% (95% CI: 27.1 to 27.9, significant) (NYC). For activity-interests and national obesity outcomes, the average root mean square prediction error from 10-fold cross validation was comparable to the average root mean square error of a model developed using the entire data set.

Conclusions: Activity-related interests across the USA and sedentary-related interests across NYC were significantly associated with obesity prevalence. Further research is needed to understand how the online social environment relates to health outcomes and how it can be used to identify or target interventions.


Conflict of interest statement

Competing Interests: Dr. Ayers declares that a company he holds equity in has advised the Hopkins Weight Management Center on advertising. However, this does not alter the authors’ adherence to all the PLOS ONE policies on sharing data and materials.

Figures

Figure 1
Figure 1. Range of proportions of users by interest category and geography.
Proportion of Facebook users across neighborhoods in NYC and metropolitans or micropolitans in USA with activity-related interests or interest in television.
Figure 2
Figure 2. Relationship between interests and obesity prevalence.
Greater proportion of users with activity related interests (a [USA] and c [NYC]) corresponds to lower prevalence of obesity. Greater proportion of users with television interests corresponds to higher prevalence of obesity (b [USA] and d [NYC]). Dashed lines are the mean expected value of proportion of overweight or obese in the population and points show the exact values. 95% confidence intervals illustrated via the shaded region, which outlines the dashed line.
Figure 3
Figure 3. Prevalence of activity-related interests and obesity in the USA.
Squares for each metropolitan or micropolitan used in the study, color-coded by (a) population prevalence of obese and/or overweight people or (b) the proportion of the population with activity-related interests. Metropolitans in grey are in the middle 25% based on proportion of individuals. Proportion of obese or overweight is color-coded from red to green (more to less) (a), and proportion of activity-related interests from red to green (less to more) (b). For the data from Facebook (b), the place with the minimum proportion of people with activity-related interests is demarcated by “+”, and place with maximum proportion by “*”.
Figure 4
Figure 4. Prevalence of television interests and obesity in New York City.
Neighborhoods in NYC are color-coded based on the (a) population prevalence of obese and/or overweight people or (b) the proportion of the population with television-related interests. Neighborhoods in grey are in the middle 25% based on proportion of individuals. Proportion of obese or overweight is color-coded from red to green (more to less) (a), and proportion of television-related interests from red to green (more to less) (b). For the data from Facebook (b), the neighborhood with the minimum proportion of people with activity-related interests is demarcated by “+”, and neighborhood with maximum proportion by “*”.

References

    1. Hill J, Peters J (1998) Environmental Contributios to the Obesity Epidemic. Science 280: 1371–1374. - PubMed
    1. Ogden CL, Carroll MD, Kit BK, Flegal KM (2012) Prevalence of obesity and trends in body mass index among US children and adolescents, 1999–2010. J Am Med Assoc 307: 483–490. Epub 2012 Jan 2017. - PMC - PubMed
    1. Kim S, Moon S, Popkin B (2000) The nutrition transition in South Korea. Am J Clin Nutr 71: 44–53. - PubMed
    1. Sallis JF, Saelens BE, Frank LD, Conway TL, Slymen DJ, et al. (2009) Neighborhood built environment and income: examining multiple health outcomes. Soc Sci Med 68: 1285–1293. - PMC - PubMed
    1. Van Dyck D, Cerin E, Conway TL, De Bourdeaudhuij I, Owen N, et al. (2012) Associations between perceived neighborhood environmental attributes and adults’ sedentary behavior: findings from the U.S.A., Australia and Belgium. Soc Sci Med 74: 1375–1384. - PMC - PubMed

Publication types