. 2013 Apr 25;8(4):e61655.
doi: 10.1371/journal.pone.0061655. Print 2013.

Inactivation of the CovR/S virulence regulator impairs infection in an improved murine model of Streptococcus pyogenes naso-pharyngeal infection

Affiliations

Inactivation of the CovR/S virulence regulator impairs infection in an improved murine model of Streptococcus pyogenes naso-pharyngeal infection

Faraz M Alam et al. PLoS One. .

Erratum in

  • PLoS One. 2013;8(9):doi/10.1371/annotation/1144e132-9e69-47bb-8e65-1414dbb01db7

Abstract

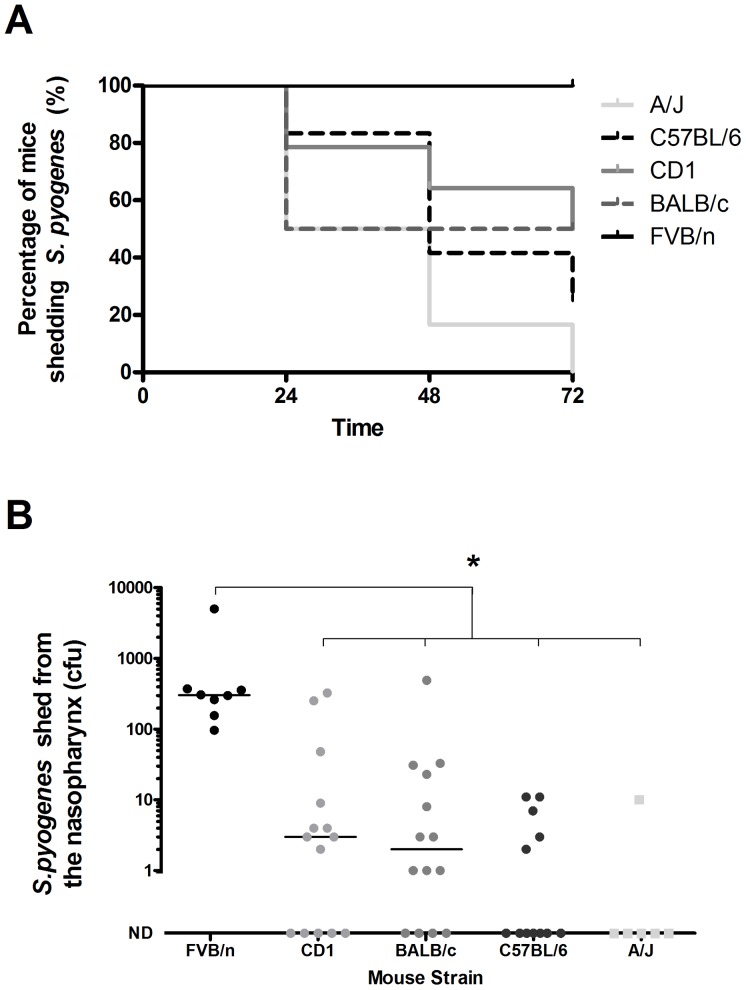
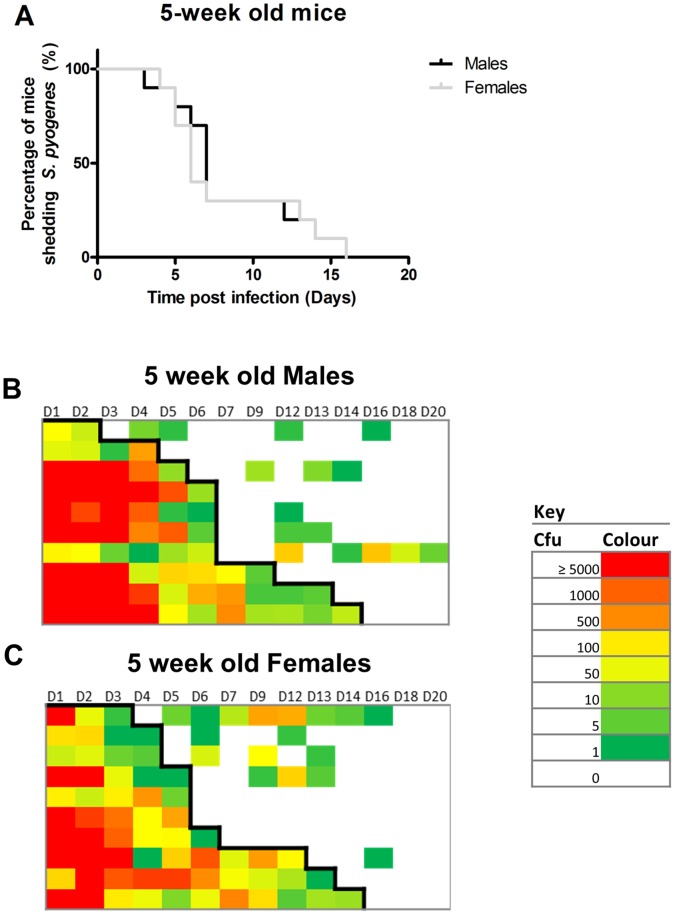
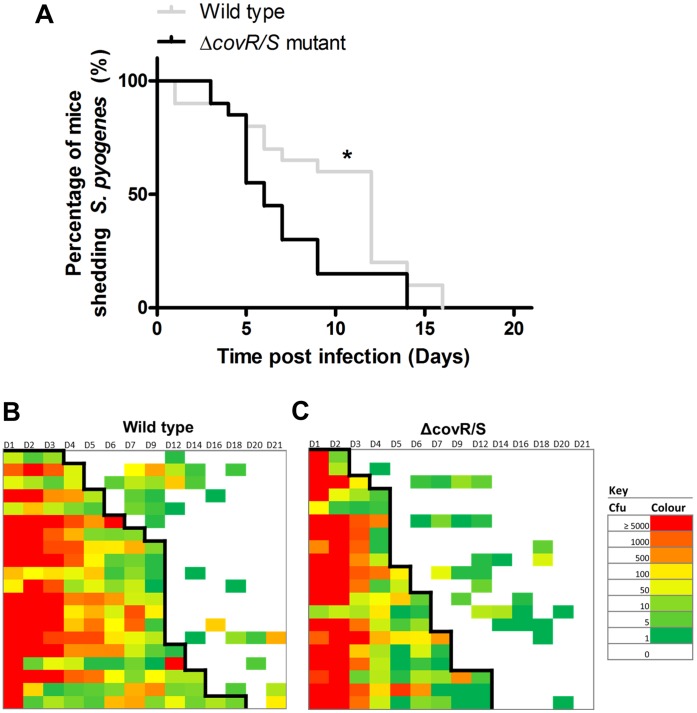
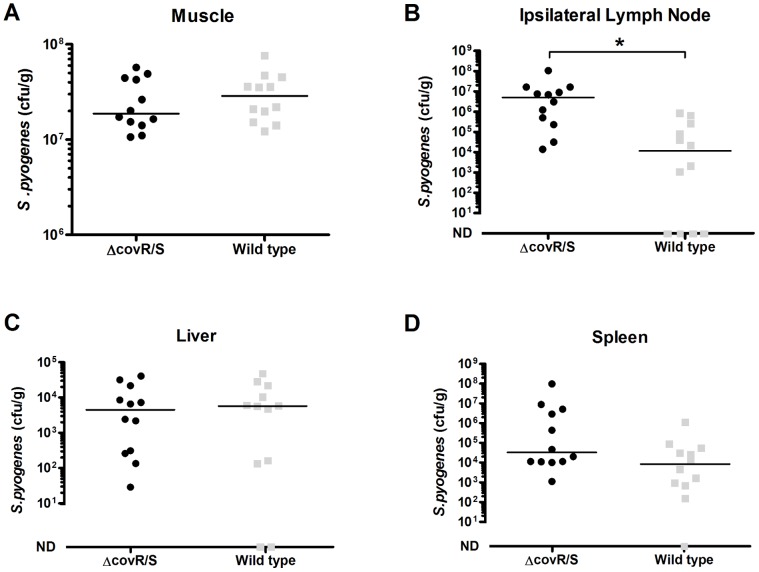
Streptococcus pyogenes is a leading cause of pharyngeal infection, with an estimated 616 million cases per year. The human nasopharynx represents the major reservoir for all S. pyogenes infection, including severe invasive disease. To investigate bacterial and host factors that influence S. pyogenes infection, we have devised an improved murine model of nasopharyngeal colonization, with an optimized dosing volume to avoid fulminant infections and a sensitive host strain. In addition we have utilized a refined technique for longitudinal monitoring of bacterial burden that is non-invasive thereby reducing the numbers of animals required. The model was used to demonstrate that the two component regulatory system, CovR/S, is required for optimum infection and transmission from the nasopharynx. There is a fitness cost conferred by covR/S mutation that is specific to the nasopharynx. This may explain why S. pyogenes with altered covR/S have not become prevalent in community infections despite possessing a selective advantage in invasive infection.


Conflict of interest statement

Competing Interests: The authors have declared that no competing interests exist.

Figures

Figure 1
Figure 1. Bioluminescence imaging of bacterial distribution after intranasal inoculation with bioluminescent C.rodentium.
109 colony forming units (cfu) of bioluminescent C. rodentium were administered intranasally to 8 week old CD1 outbred female mice in 20 µl (n = 3), 10 µl (n = 2), 5 µl (n = 3) and 2.5 µl (n = 2) of PBS. Images were acquired using an IVIS spectrum system, and are displayed as images of peak bioluminescence, with variations in colour representing light intensity at a given location. Red represents the most intense light emission, while blue corresponds to the weakest signal. The colour bar indicates relative signal intensity (as photons s−1 cm2 sr−1). Two representative mice shown for each group.
Figure 2
Figure 2. Correlation between S. pyogenes recovered from nasal shedding and from nasopharyngeal dissection.
Data are pooled from direct nasal samples taken on days 3, 7, and 14 from five week old female FVB/n mice during intranasal infection with emm75 S. pyogenes (1.3×10⁸ cfu) were compared to bacterial numbers obtained on dissection on the same days. (r2>0.95, n = 36). Data shown from individual mice.
Figure 3
Figure 3. Comparison of nasopharyngeal shedding of S. pyogenes between different mouse strains.
Five week old male mice of different strain backgrounds were inoculated intranasally with emm75 S. pyogenes (1.5×10⁸ cfu). Duration and quantity of shedding were determined from colonies recovered from direct nasal sampling of the mouse nasopharynx. (A) Kaplan-Meier plot showing percentage of mice shedding S. pyogenes in each group. (B) Bacterial counts shed by FVB/n (n = 8) CD1 (n = 14), BALB/c (n = 14), C57BL/6 (n = 12) and A/J (n = 6) at 72 hours. Individual points represent individual mice. (Kruskal Wallis with Dunns Post Test p<0.05). Bars indicate the median, ND = no detectable bacteria.
Figure 4
Figure 4. Sex differences in S .
pyogenes nasopharyngeal carriage and shedding intensity in 5 week old mice. Male and female FVB/n mice 5 weeks (A, p>0.05 Mantel–Cox Logrank test, n = 10) of age were infected intranasally with emm75 S. pyogenes (1.1×10⁸ cfu) and sampled non-invasively through direct nasal sampling over 21 days. Shedding intensity maps display the data from direct nasal samples throughout the time course from the male mice (B) and the female mice (C). Rows indicate individual mice throughout the time course, colours indicate the numbers of S. pyogenes recovered from direct nasal samples with red indicating the highest recorded levels of carriage (≥5000 cfu) and green indicates the lowest levels of carriage (1 cfu) and blank blocks indicate no recovery of S. pyogenes. Black line indicates survival based on the first loss of carriage.
Figure 5
Figure 5. Sex differences in S.
pyogenes nasopharyngeal carriage and shedding intensity in 10 week old mice. Male and female FVB/n 10 weeks (A, p<0.05 Mantel–Cox Logrank test, n = 10) of age were infected intranasally with emm75 S. pyogenes (1.1×10⁸ cfu) and sampled non-invasively through direct nasal sampling over 21 days. Male mice carried S. pyogenes for significantly longer than the female mice in this age group. Shedding intensity maps display the data from direct nasal samples throughout the time course from the male mice (B) and the female mice (C). Rows indicate individual mice throughout the time course, colours indicate the numbers of S. pyogenes recovered from direct nasal samples with red indicating the highest recorded levels of carriage (≥5000 cfu) and green indicates the lowest levels of carriage (1 cfu) and blank blocks indicate no recovery of S. pyogenes. Black line indicates survival based on the first loss of carriage.
Figure 6
Figure 6. Nasopharyngeal infection is adversely affected by covR/S mutation.
Five week old female FVB/n mice were inoculated intranasally with either emm75 S. pyogenes, or ΔcovR/S S. pyogenes. To determine the duration of shedding, direct nasal samples were taken over a 21 day period. The wild type strain was shed over a significantly longer time period than the ΔcovR/S strain (A, 1.5×10⁸ cfu per dose, n = 20 per group, Logrank Mantel Cox p<0.05). Shedding intensity maps display the data from direct nasal samples throughout the time course from the groups infected with the wild type emm75 strain (B) and the mice infected with the ΔcovR/S strain (C). Rows indicate individual mice throughout the time course, colours indicate the numbers of S. pyogenes recovered from direct nasal samples with red indicating the highest recorded levels of carriage (≥5000 cfu) and green indicates the lowest levels of carriage (1 cfu) and blank blocks indicate no recovery of S. pyogenes. Black line indicates survival based on the first loss of carriage.
Figure 7
Figure 7. The effects of covR/S mutation on dissemination from an invasive intramuscular infection.
Five week old FVB/n female mice (n = 12) were infected intramuscularly in the right thigh with either wild type S. pyogenes or an isogenic ΔcovR/S strain (6×10⁸ cfu per dose). After three days there was no significant difference in bacterial growth within the thigh (A, Mann Whitney U p>0.05), but there was a significant difference in bacterial numbers that had disseminated to the inguinal node (B, Mann Whitney U p<0.05). No significant difference in dissemination to the liver (C) and the spleen (D) was found between the wild type and the ΔcovR/S strains. Median indicated by a black line.
Figure 8
Figure 8. Histopathological analysis of the caudal nasal cavity during long term nasal infection.
Photomicrographs demonstrating five week old female FVB/n mice infected with either the emm75 S. pyogenes (A–D) or the emm75 ΔcovR/S strain (E–H) (1.5×10⁸ cfu per dose, n = 3 per group) were taken at days 3, 7, 14 and 21 after inoculation (Haemotoxylin & Eosin staining). n = Neutrophilic Exudate, m = Nasal mucosa, s = Nasal stroma. Scale bar as shown. Damage to the nasal mucosa with surface neutrophilic exudate was apparent at day 3 post inoculation with both strains (A & E). The nasal epithelia of mice in both groups were widely eroded or ulcerated by day 7 (B) than those infected with the ΔcovR/S strain (F). At day 14 the inflammation had begun to resolve in both strains (C & G). By day 21, mice in all groups had histologically normal mucosa (D & H). Control mice over the time course are shown in (I–L). Semi quantitative analysis of the histopathology was undertaken to determine the severity of infection and assigned a numerical designation for each time point (n = 3 mice per time point). − = No significant abnormality,+ = Mild,++ = Moderate,+++ = Marked,++++ = Severe and ND = Non diagnostic sections (M).
Figure 9
Figure 9. Density of infected carriers determines the burden of transmitted infection.
Five week old female FVB/n donor mice infected intranasally with S. pyogenes (1.63×10⁸ cfu per dose) were introduced into a cage of naïve recipient female mice. The Donor: Recipient (D:R) ratio was varied between 4∶4, 3∶5 and 2∶6 between cages. Recipient mice were sampled at 4, 24, 48, 72 and 96 hours after the infection and introduction of the donor mice to a cage. Data show counts from direct nasal sampling from recipient mice only. Donor mice had >5000 cfu recovered at all time points (not shown). The burden of transmitted infection was significantly higher in cages with a D:R ratio of 4∶4 compared with cages with a 2∶4 ratio. (AUC analysis, followed by Kruskal Wallis with Dunns Post test p<0.05). Lines indicate the median and the interquartile range.
Figure 10
Figure 10. Transmission of S. pyogenes is hampered by loss of covR/S regulation.
Naïve five week old female FVB/n recipients co-mingled at a D:R ratio of 3∶5 with female FVB/n mice infected with either the emm75 wild type strain or it’s isogenic ΔcovR/S strain (5 ×10⁸ cfu per dose) and sampled after the introduction of the donor mice. Donor mice had >5000 cfu recovered from direct nasal sampling throughout the experiment. The ΔcovR/S strain transmitted significantly less well to recipients compared to the wild type strain (A, n = 15 recipients per group, AUC analysis, followed by Mann-Whitney U test). Line indicates median, error bars indicate interquartile range. Settle plates exposed to the air in the cages revealed no significant differences in the bacteria deposited on the surface of the plates by mice infected with the strain, or the ΔcovR/S strain (B, n = 4 plates per cage, AUC analysis followed by Mann-Whitney U test p>0.05) Data is shown for individual animals with medians indicated by black line.

References

    1. Carapetis JR, Steer AC, Mulholland EK, Weber M (2005) The global burden of group A streptococcal diseases. Lancet Infect Dis 5: 685–694. - PubMed
    1. Wiles S, Hanage WP, Frankel G, Robertson BD (2006) Modelling infectious disease–time to think outside the box? Nature Rev Microbiol 4: 307–312. - PubMed
    1. Hillenius WJ (1992) The evolution of nasal turbinates and mammalian endothermy. Paleobiology 18: 17–29.
    1. Slípka J (1988) Palatine tonsils–their evolution and ontogeny. Acta Oto-Laryngol 454: 18–22. - PubMed
    1. Wu HY, Nguyen H, Russell MW (1997) Nasal lymphoid tissue (NALT) as a mucosal immune inductive site. Scand J Immunol 46: 506–513. - PubMed

Publication types

MeSH terms

Substances