

Genetic hitchhiking under heterogeneous spatial selection pressures
- PMID: 23637897
- PMCID: PMC3634857
- DOI: 10.1371/journal.pone.0061742
Genetic hitchhiking under heterogeneous spatial selection pressures
Abstract
During adaptive evolutionary processes substantial heterogeneity in selective pressure might act across local habitats in sympatry. Examples are selection for drug resistance in malaria or herbicide resistance in weeds. In such setups standard population-genetic assumptions (homogeneous constant selection pressures, random mating etc.) are likely to be violated. To avoid misinferences on the strength and pattern of natural selection it is therefore necessary to adjust population-genetic theory to meet the specifics driving adaptive processes in particular organisms. We introduce a deterministic model in which selection acts heterogeneously on a population of haploid individuals across different patches over which the population randomly disperses every generation. A fixed proportion of individuals mates exclusively within patches, whereas the rest mates randomly across all patches. We study how the allele frequencies at neutral markers are affected by the spread of a beneficial mutation at a closely linked locus (genetic hitchhiking). We provide an analytical solution for the frequency change and the expected heterozygosity at the neutral locus after a single copy of a beneficial mutation became fixed. We furthermore provide approximations of these solutions which allow for more obvious interpretations. In addition, we validate the results by stochastic simulations. Our results show that the application of standard population-genetic theory is accurate as long as differences across selective environments are moderate. However, if selective differences are substantial, as for drug resistance in malaria, herbicide resistance in weeds, or insecticide resistance in agriculture, it is necessary to adapt available theory to the specifics of particular organisms.
Conflict of interest statement
Figures
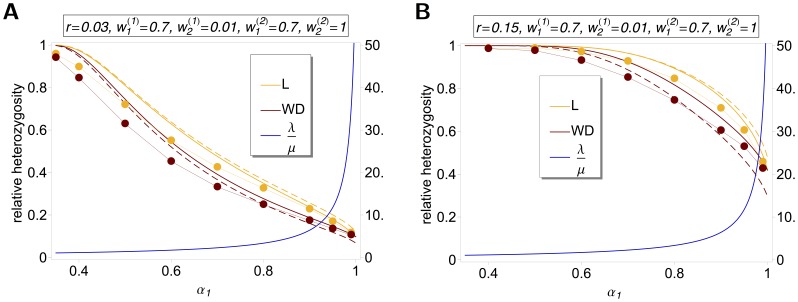
 (left y-axis) and
  (right y-axis) as a function of
  assuming two patches (
 ). We assume either complete within-patch mating and dispersion (WD;
  ) according to the model introduced here, or the hard-selection Levene model (L;
  ). Solid lines correspond to exact solutions according to equations (15) and (18), respectively. Dashed lines show approximate solutions according to equation (25a) combined with equations (25b) and (25c), respectively. Dots represent the values obtained from stochastic simulations. Fitness values are shown in the boxes above the plot panels in (A) and (B). Stochastic simulations are based on
  repetitions for each parameter combination and
  . For the exact and approximate solutions we assumed
  to compensate for the deterministic solution's overestimation of heterozygosity due to the prolonged initial spread of the beneficial mutation in the deterministic model.
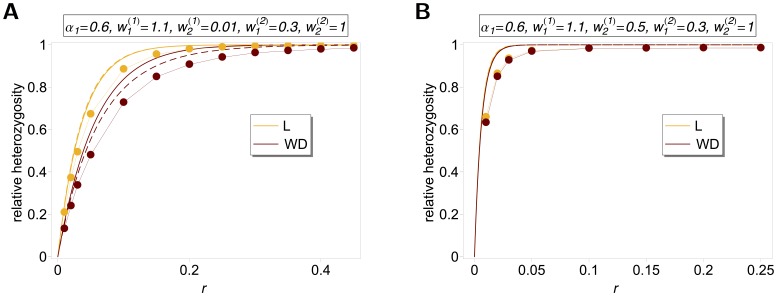
 as a function of
  . See legend of Figure 1 for more details.
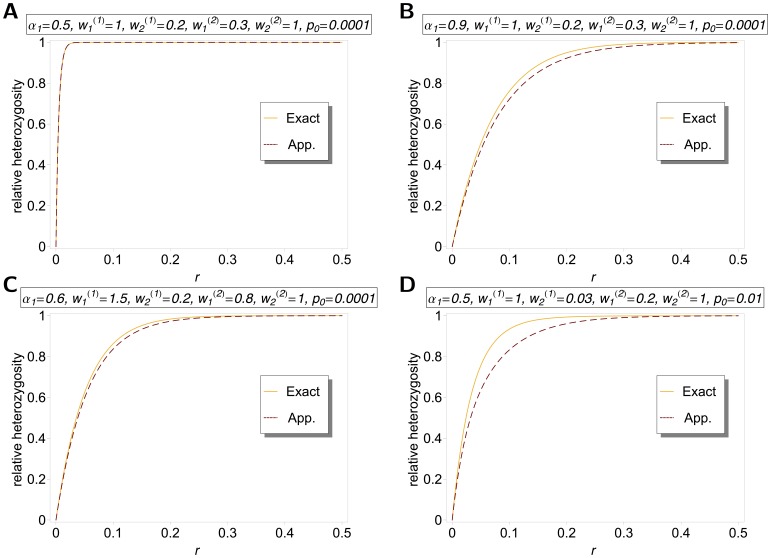
 as a function of
  as given by (15) and (18), and equation (25a) combined with equation (25b). Two patches with
  were assumed. Moreover, fitness parameters and initial frequencies are shown in the boxes above the plot panels in (A), (B), (C), and (D).
References
-
- Maynard Smith J, Haigh J (1974) The hitch-hiking effect of a favourable gene. Genetics Research 23: 23–35. - PubMed
-
- Stephan W, Wiehe THE, Lenz MW (1992) The effect of strongly selected substitutions on neutral polymorphism: Analytical results based on diffusion theory. Theoretical Population Biology 41: 237–254.
-
- Etheridge A, Pfaffelhuber P, Wakolbinger A (2006) An approximate sampling formula under genetic hitchhiking. The Annals of Applied Probability 16: 685–729.
Publication types
MeSH terms
Grants and funding
LinkOut - more resources
Full Text Sources
Other Literature Sources
