

A comprehensive, multi-scale dynamical model of ErbB receptor signal transduction in human mammary epithelial cells
- PMID: 23637902
- PMCID: PMC3630219
- DOI: 10.1371/journal.pone.0061757
A comprehensive, multi-scale dynamical model of ErbB receptor signal transduction in human mammary epithelial cells
Abstract
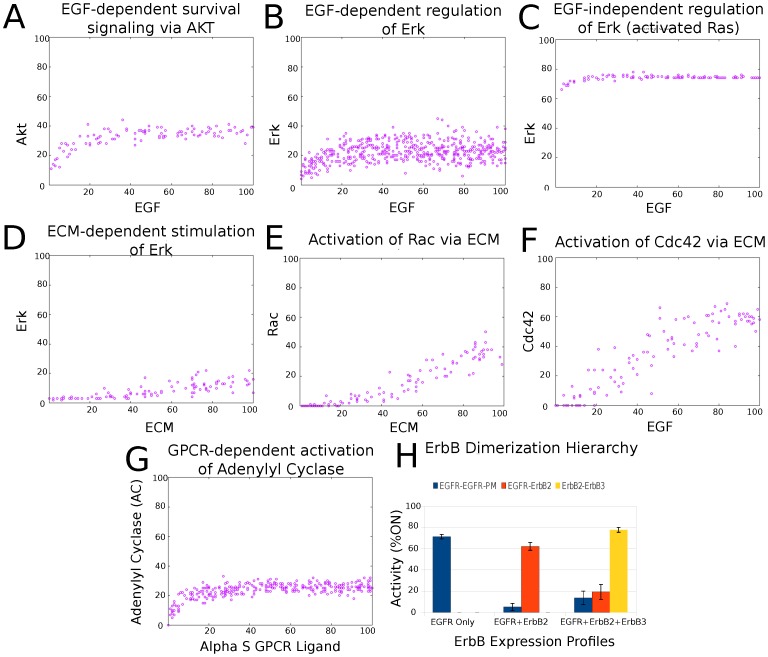
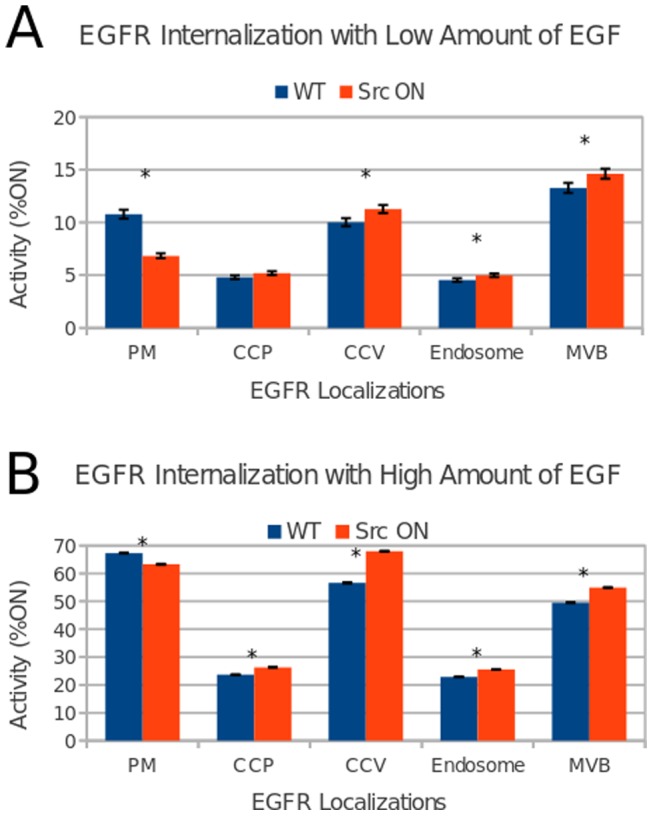
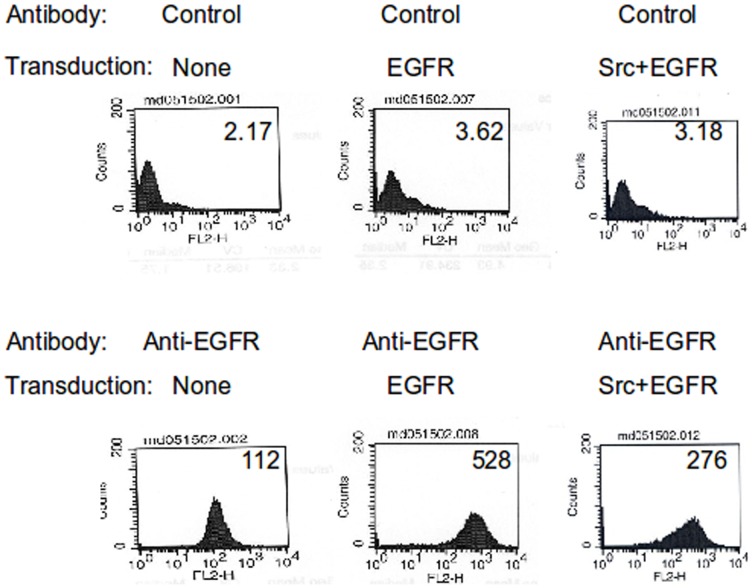
The non-receptor tyrosine kinase Src and receptor tyrosine kinase epidermal growth factor receptor (EGFR/ErbB1) have been established as collaborators in cellular signaling and their combined dysregulation plays key roles in human cancers, including breast cancer. In part due to the complexity of the biochemical network associated with the regulation of these proteins as well as their cellular functions, the role of Src in EGFR regulation remains unclear. Herein we present a new comprehensive, multi-scale dynamical model of ErbB receptor signal transduction in human mammary epithelial cells. This model, constructed manually from published biochemical literature, consists of 245 nodes representing proteins and their post-translational modifications sites, and over 1,000 biochemical interactions. Using computer simulations of the model, we find it is able to reproduce a number of cellular phenomena. Furthermore, the model predicts that overexpression of Src results in increased endocytosis of EGFR in the absence/low amount of the epidermal growth factor (EGF). Our subsequent laboratory experiments also suggest increased internalization of EGFR upon Src overexpression under EGF-deprived conditions, further supporting this model-generated hypothesis.
Conflict of interest statement
Figures


Similar articles
-
EGF receptor signaling stimulates SRC kinase phosphorylation of clathrin, influencing clathrin redistribution and EGF uptake.Cell. 1999 Mar 5;96(5):677-87. doi: 10.1016/s0092-8674(00)80578-4. Cell. 1999. PMID: 10089883
-
Specific epidermal growth factor receptor autophosphorylation sites promote mouse colon epithelial cell chemotaxis and restitution.Am J Physiol Gastrointest Liver Physiol. 2011 Aug;301(2):G368-76. doi: 10.1152/ajpgi.00327.2010. Epub 2011 May 26. Am J Physiol Gastrointest Liver Physiol. 2011. PMID: 21617115 Free PMC article.
-
Epidermal growth factor receptor acts as a negative regulator for bacterium nontypeable Haemophilus influenzae-induced Toll-like receptor 2 expression via an Src-dependent p38 mitogen-activated protein kinase signaling pathway.J Biol Chem. 2005 Oct 28;280(43):36185-94. doi: 10.1074/jbc.M503941200. Epub 2005 Aug 22. J Biol Chem. 2005. PMID: 16115866
-
Receptor tyrosine kinases endocytosis in endothelium: biology and signaling.Arterioscler Thromb Vasc Biol. 2014 Sep;34(9):1831-7. doi: 10.1161/ATVBAHA.114.303217. Epub 2014 Jun 12. Arterioscler Thromb Vasc Biol. 2014. PMID: 24925972 Free PMC article. Review.
-
Epidermal growth factor receptors: critical mediators of multiple receptor pathways.Curr Opin Cell Biol. 1999 Apr;11(2):184-9. doi: 10.1016/s0955-0674(99)80024-6. Curr Opin Cell Biol. 1999. PMID: 10209149 Review.
Cited by
-
A Near-Optimal Control Method for Stochastic Boolean Networks.Lett Biomath. 2020 May 4;7(1):67-80. Lett Biomath. 2020. PMID: 34141873 Free PMC article.
-
Design, Assessment, and in vivo Evaluation of a Computational Model Illustrating the Role of CAV1 in CD4(+) T-lymphocytes.Front Immunol. 2014 Dec 5;5:599. doi: 10.3389/fimmu.2014.00599. eCollection 2014. Front Immunol. 2014. PMID: 25538703 Free PMC article.
-
SBML qualitative models: a model representation format and infrastructure to foster interactions between qualitative modelling formalisms and tools.BMC Syst Biol. 2013 Dec 10;7:135. doi: 10.1186/1752-0509-7-135. BMC Syst Biol. 2013. PMID: 24321545 Free PMC article.
-
Partial Response to Pyrotinib Plus Capecitabine in an Advanced Breast Cancer Patient with HER2 Amplification and R157W Mutation After Anti-HER2 Treatment: A Case Report and Literature Review.Onco Targets Ther. 2021 Mar 2;14:1581-1588. doi: 10.2147/OTT.S289876. eCollection 2021. Onco Targets Ther. 2021. PMID: 33688205 Free PMC article.
-
Attractor - a new turning point in drug discovery.Drug Des Devel Ther. 2019 Aug 22;13:2957-2968. doi: 10.2147/DDDT.S216397. eCollection 2019. Drug Des Devel Ther. 2019. PMID: 31686779 Free PMC article. Review.
References
-
- Hynes NE, Lane HA (2005) ERBB receptors and cancer: the complexity of targeted inhibitors. Nature reviews Cancer 5: 341–354 doi:10.1038/nrc1609 - DOI - PubMed
-
- Hynes NE, MacDonald G (2009) ErbB receptors and signaling pathways in cancer. Curr Opin Cell Biol 21: 177–184. - PubMed
-
- Yarden Y (2001) Biology of HER2 and its importance in breast cancer. Oncology 61 Suppl 2: 1–13. - PubMed
Publication types
MeSH terms
Substances
Grants and funding
- R01 CA087986/CA/NCI NIH HHS/United States
- CA105489/CA/NCI NIH HHS/United States
- U01 CA151806/CA/NCI NIH HHS/United States
- CA116552/CA/NCI NIH HHS/United States
- R01 CA116552/CA/NCI NIH HHS/United States
- CA99163/CA/NCI NIH HHS/United States
- R01 CA099163/CA/NCI NIH HHS/United States
- CA144027/CA/NCI NIH HHS/United States
- 5U01CA151806-02/CA/NCI NIH HHS/United States
- CA87986/CA/NCI NIH HHS/United States
- R01 CA096844/CA/NCI NIH HHS/United States
- CA96844/CA/NCI NIH HHS/United States
- R01 CA144027/CA/NCI NIH HHS/United States
- R01 CA105489/CA/NCI NIH HHS/United States
LinkOut - more resources
Full Text Sources
Other Literature Sources
Research Materials
Miscellaneous
