

Representation of early sensory experience in the adult auditory midbrain: implications for vocal learning
- PMID: 23637903
- PMCID: PMC3634856
- DOI: 10.1371/journal.pone.0061764
Representation of early sensory experience in the adult auditory midbrain: implications for vocal learning
Abstract
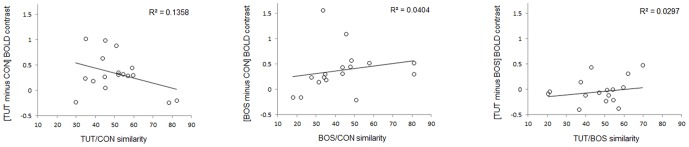
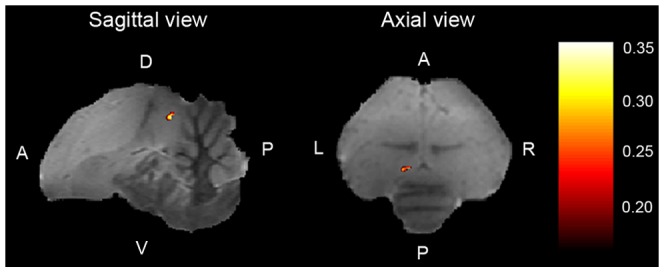
Vocal learning in songbirds and humans occurs by imitation of adult vocalizations. In both groups, vocal learning includes a perceptual phase during which juveniles birds and infants memorize adult vocalizations. Despite intensive research, the neural mechanisms supporting this auditory memory are still poorly understood. The present functional MRI study demonstrates that in adult zebra finches, the right auditory midbrain nucleus responds selectively to the copied vocalizations. The selective signal is distinct from selectivity for the bird's own song and does not simply reflect acoustic differences between the stimuli. Furthermore, the amplitude of the selective signal is positively correlated with the strength of vocal learning, measured by the amount of song that experimental birds copied from the adult model. These results indicate that early sensory experience can generate a long-lasting memory trace in the auditory midbrain of songbirds that may support song learning.
Conflict of interest statement
Figures


Similar articles
-
A bird's own song contributes to conspecific song perception.Neuroreport. 1999 Jun 3;10(8):1773-8. doi: 10.1097/00001756-199906030-00027. Neuroreport. 1999. PMID: 10501573
-
Early auditory experience generates long-lasting memories that may subserve vocal learning in songbirds.Proc Natl Acad Sci U S A. 2006 Jan 24;103(4):1088-93. doi: 10.1073/pnas.0510136103. Epub 2006 Jan 17. Proc Natl Acad Sci U S A. 2006. PMID: 16418265 Free PMC article.
-
Neural processing of auditory feedback during vocal practice in a songbird.Nature. 2009 Jan 8;457(7226):187-90. doi: 10.1038/nature07467. Epub 2008 Nov 12. Nature. 2009. PMID: 19005471
-
Song selectivity in the song system and in the auditory forebrain.Ann N Y Acad Sci. 2004 Jun;1016:222-45. doi: 10.1196/annals.1298.023. Ann N Y Acad Sci. 2004. PMID: 15313778 Review.
-
Motor mechanisms relevant to auditory-vocal interactions in songbirds.Brain Behav Evol. 1994;44(4-5):265-78. doi: 10.1159/000113581. Brain Behav Evol. 1994. PMID: 7842285 Review.
Cited by
-
The current status and trend of the functional magnetic resonance combined with stimulation in animals.Front Neurosci. 2022 Sep 23;16:963175. doi: 10.3389/fnins.2022.963175. eCollection 2022. Front Neurosci. 2022. PMID: 36213733 Free PMC article.
-
Predicting plasticity: acute context-dependent changes to vocal performance predict long-term age-dependent changes.J Neurophysiol. 2015 Oct;114(4):2328-39. doi: 10.1152/jn.00688.2015. Epub 2015 Aug 26. J Neurophysiol. 2015. PMID: 26311186 Free PMC article.
-
Auditory processing in the zebra finch midbrain: single unit responses and effect of rearing experience.PeerJ. 2020 Jul 24;8:e9363. doi: 10.7717/peerj.9363. eCollection 2020. PeerJ. 2020. PMID: 32775046 Free PMC article.
-
Song Processing in the Zebra Finch Auditory Forebrain Reflects Asymmetric Sensitivity to Temporal and Spectral Structure.Front Neurosci. 2017 Oct 5;11:549. doi: 10.3389/fnins.2017.00549. eCollection 2017. Front Neurosci. 2017. PMID: 29051725 Free PMC article.
-
Tracing the development of learned song preferences in the female zebra finch brain with functional magnetic resonance imaging.Dev Neurobiol. 2024 Apr;84(2):47-58. doi: 10.1002/dneu.22934. Epub 2024 Mar 11. Dev Neurobiol. 2024. PMID: 38466218 Free PMC article.
References
-
- Doupe AJ, Kuhl PK (1999) Birdsong and human speech: common themes and mechanisms. Ann Rev Neurosci 22: 567–631. - PubMed
-
- Wilbrecht L, Nottebohm F (2003) Vocal learning in birds and humans. Ment Retard Dev Disabil Res Rev 9: 135–148. - PubMed
-
- Bolhuis JJ, Okanoya K, Scharff C (2010) Twitter evolution: converging mechanisms in birdsong and human speech. Nat Rev Neurosci 11: 747–759. - PubMed
-
- Konishi M (1965) The role of auditory feedback in the control of vocalization in the white-crowned sparrow. Z Tierpsychol 22: 770–783. - PubMed
Publication types
MeSH terms
LinkOut - more resources
Full Text Sources
Other Literature Sources
