

Epigenetic inactivation of Notch-Hes pathway in human B-cell acute lymphoblastic leukemia
- PMID: 23637910
- PMCID: PMC3637323
- DOI: 10.1371/journal.pone.0061807
Epigenetic inactivation of Notch-Hes pathway in human B-cell acute lymphoblastic leukemia
Abstract
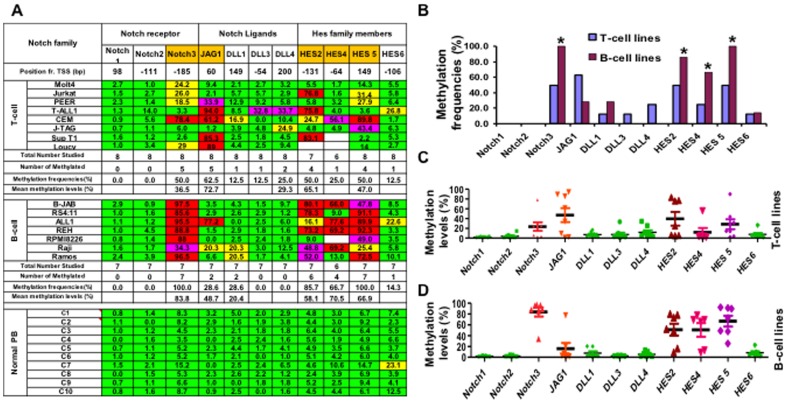
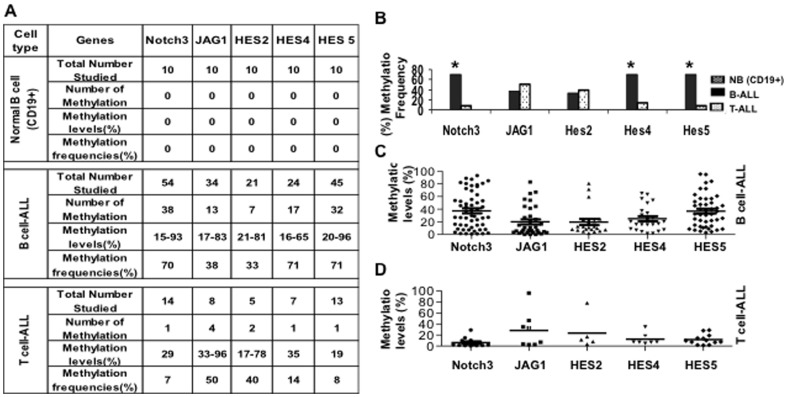
The Notch pathway can have both oncogenic and tumor suppressor roles, depending on cell context. For example, Notch signaling promotes T cell differentiation and is leukemogenic in T cells, whereas it inhibits early B cell differentiation and acts as a tumor suppressor in B cell leukemia where it induces growth arrest and apoptosis. The regulatory mechanisms that contribute to these opposing roles are not understood. Aberrant promoter DNA methylation and histone modifications are associated with silencing of tumor suppressor genes and have been implicated in leukemogenesis. Using methylated CpG island amplification (MCA)/DNA promoter microarray, we identified Notch3 and Hes5 as hypermethylated in human B cell acute lymphoblastic leukemia (ALL). We investigated the methylation status of other Notch pathway genes by bisulfite pyrosequencing. Notch3, JAG1, Hes2, Hes4 and Hes5 were frequently hypermethylated in B leukemia cell lines and primary B-ALL, in contrast to T-ALL cell lines and patient samples. Aberrant methylation of Notch3 and Hes5 in B-ALL was associated with gene silencing and was accompanied by decrease of H3K4 trimethylation and H3K9 acetylation and gain of H3K9 trimethylation and H3K27 trimethylation. 5-aza-2'-deoxycytidine treatment restored Hes5 expression and decreased promoter hypermethylation in most leukemia cell lines and primary B-ALL samples. Restoration of Hes5 expression by lentiviral transduction resulted in growth arrest and apoptosis in Hes5 negative B-ALL cells but not in Hes5 expressing T-ALL cells. These data suggest that epigenetic modifications are implicated in silencing of tumor suppressor of Notch/Hes pathway in B-ALL.
Conflict of interest statement
Figures


Similar articles
-
Epigenetically dysregulated NOTCH-Delta-HES signaling cascade can serve as a subtype classifier for acute lymphoblastic leukemia.Ann Hematol. 2024 Feb;103(2):511-523. doi: 10.1007/s00277-023-05515-9. Epub 2023 Nov 3. Ann Hematol. 2024. PMID: 37922005
-
Notch-3 and Notch-4 signaling rescue from apoptosis human B-ALL cells in contact with human bone marrow-derived mesenchymal stromal cells.Blood. 2011 Jul 14;118(2):380-9. doi: 10.1182/blood-2010-12-326694. Epub 2011 May 20. Blood. 2011. PMID: 21602525
-
Neuralized1 causes apoptosis and downregulates Notch target genes in medulloblastoma.Neuro Oncol. 2010 Dec;12(12):1244-56. doi: 10.1093/neuonc/noq091. Epub 2010 Sep 16. Neuro Oncol. 2010. PMID: 20847082 Free PMC article.
-
Mutations that collaborate with IL-7Ra signaling pathways to drive ALL.Adv Biol Regul. 2021 May;80:100788. doi: 10.1016/j.jbior.2021.100788. Epub 2021 Jan 21. Adv Biol Regul. 2021. PMID: 33578108 Review.
-
Role of Notch signaling pathway in gastric cancer: a meta-analysis of the literature.World J Gastroenterol. 2014 Jul 21;20(27):9191-9. doi: 10.3748/wjg.v20.i27.9191. World J Gastroenterol. 2014. PMID: 25083094 Free PMC article. Review.
Cited by
-
Epigenetically dysregulated NOTCH-Delta-HES signaling cascade can serve as a subtype classifier for acute lymphoblastic leukemia.Ann Hematol. 2024 Feb;103(2):511-523. doi: 10.1007/s00277-023-05515-9. Epub 2023 Nov 3. Ann Hematol. 2024. PMID: 37922005
-
Histone Modifications Drive Aberrant Notch3 Expression/Activity and Growth in T-ALL.Front Oncol. 2019 Apr 3;9:198. doi: 10.3389/fonc.2019.00198. eCollection 2019. Front Oncol. 2019. PMID: 31001470 Free PMC article.
-
The emerging roles of Notch signaling in leukemia and stem cells.Biomark Res. 2013 Jul 18;1(1):23. doi: 10.1186/2050-7771-1-23. Biomark Res. 2013. PMID: 24252593 Free PMC article.
-
Quantitative DNA hypomethylation of ligand Jagged1 and receptor Notch1 signifies occurrence and progression of breast carcinoma.Am J Cancer Res. 2015 May 15;5(6):1897-910. eCollection 2015. Am J Cancer Res. 2015. Retraction in: Am J Cancer Res. 2016 Oct 01;6(10):2388. PMID: 26269752 Free PMC article. Retracted.
-
Notch Inhibitors and BH3 Mimetics in T-Cell Acute Lymphoblastic Leukemia.Int J Mol Sci. 2024 Nov 29;25(23):12839. doi: 10.3390/ijms252312839. Int J Mol Sci. 2024. PMID: 39684550 Free PMC article. Review.
References
-
- Jundt F, Schwarzer R, Dorken B (2008) Notch signaling in leukemias and lymphomas. Curr Mol Med 8: 51–59. - PubMed
-
- Singh N, Phillips RA, Iscove NN, Egan SE (2000) Expression of notch receptors, notch ligands, and fringe genes in hematopoiesis. Exp Hematol 28: 527–534. - PubMed
-
- Katoh M, Katoh M (2007) Integrative genomic analyses on HES/HEY family: Notch-independent HES1, HES3 transcription in undifferentiated ES cells, and Notch-dependent HES1, HES5, HEY1, HEY2, HEYL transcription in fetal tissues, adult tissues, or cancer. Int J Oncol 31: 461–466. - PubMed
Publication types
MeSH terms
Substances
Grants and funding
LinkOut - more resources
Full Text Sources
Other Literature Sources
Miscellaneous
