

Trends in breast cancer stage and mortality in Michigan (1992-2009) by race, socioeconomic status, and area healthcare resources
- PMID: 23637921
- PMCID: PMC3639257
- DOI: 10.1371/journal.pone.0061879
Trends in breast cancer stage and mortality in Michigan (1992-2009) by race, socioeconomic status, and area healthcare resources
Abstract
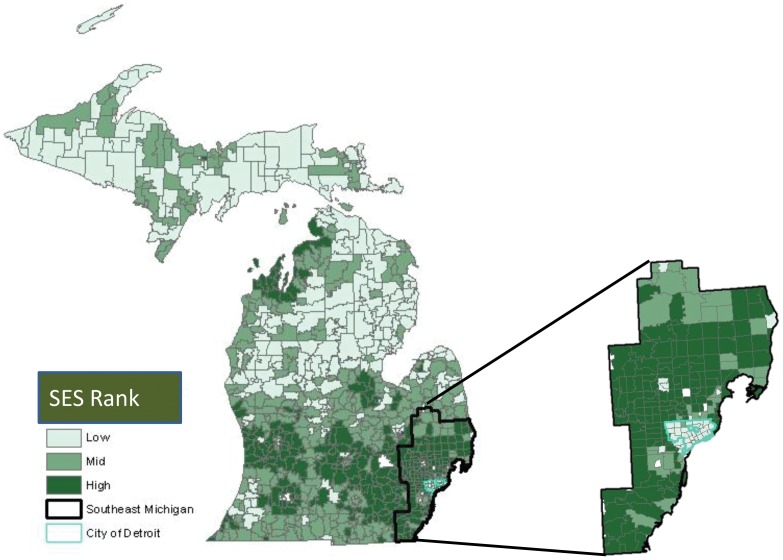
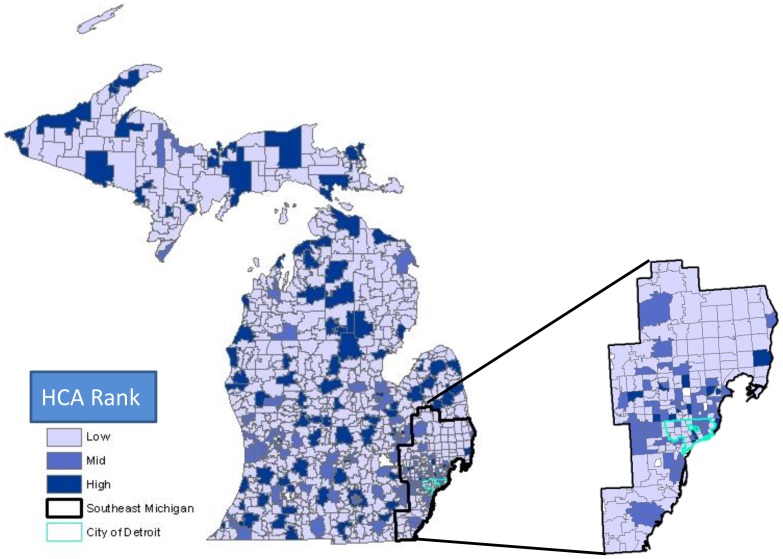
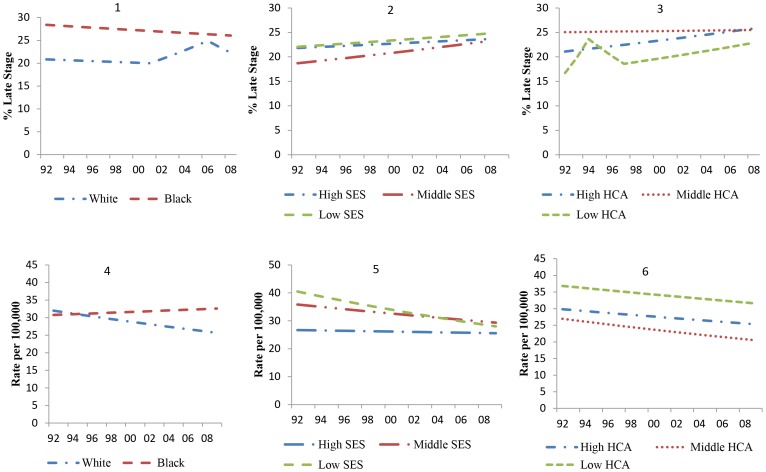
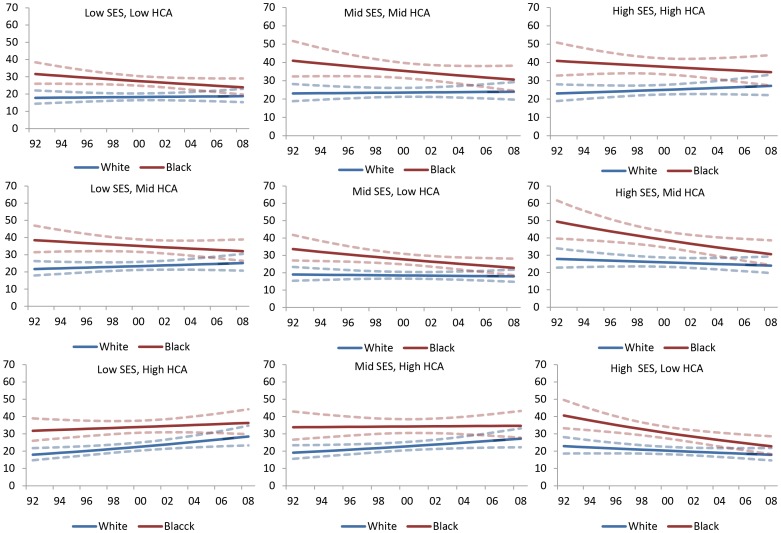
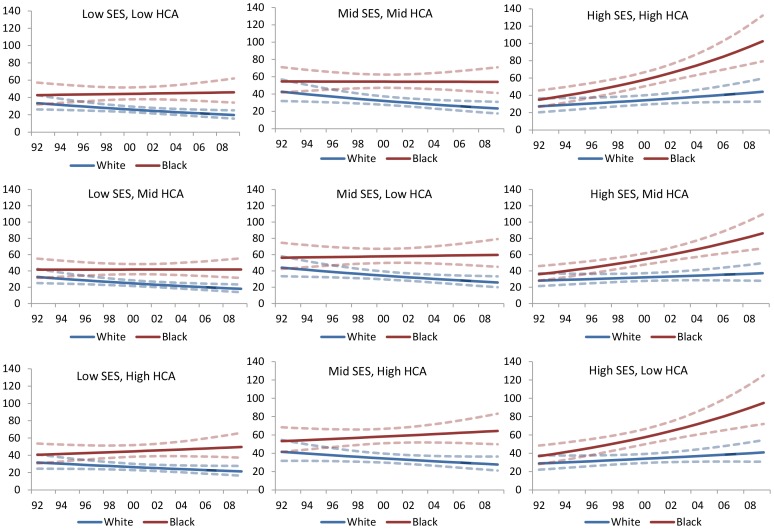
The long-term effect of socioeconomic status (SES) and healthcare resources availability (HCA) on breast cancer stage of presentation and mortality rates among patients in Michigan is unclear. Using data from the Michigan Department of Community Health (MDCH) between 1992 and 2009, we calculated annual proportions of late-stage diagnosis and age-adjusted breast cancer mortality rates by race and zip code in Michigan. SES and HCA were defined at the zip-code level. Joinpoint regression was used to compare the Average Annual Percent Change (AAPC) in the median zip-code level percent late stage diagnosis and mortality rate for blacks and whites and for each level of SES and HCA. Between 1992 and 2009, the proportion of late stage diagnosis increased among white women [AAPC = 1.0 (0.4, 1.6)], but was statistically unchanged among black women [AAPC = -0.5 (-1.9, 0.8)]. The breast cancer mortality rate declined among whites [AAPC = -1.3% (-1.8,-0.8)], but remained statistically unchanged among blacks [AAPC = -0.3% (-0.3, 1.0)]. In all SES and HCA area types, disparities in percent late stage between blacks and whites appeared to narrow over time, while the differences in breast cancer mortality rates between blacks and whites appeared to increase over time.
Conflict of interest statement
Figures
References
-
- Jemal A, Siegel R, Xu J, Ward E (2010) Cancer statistics, 2010. CA Cancer J Clin 60: 277–300. - PubMed
-
- Jatoi I, Chen BE, Anderson WF, Rosenberg PS (2007) Breast cancer mortality trends in the united states according to estrogen receptor status and age at diagnosis. J Clin Oncol 25: 1683–1690. - PubMed
Publication types
MeSH terms
LinkOut - more resources
Full Text Sources
Other Literature Sources
Medical
