

Quantifying climatological ranges and anomalies for Pacific coral reef ecosystems
- PMID: 23637939
- PMCID: PMC3630142
- DOI: 10.1371/journal.pone.0061974
Quantifying climatological ranges and anomalies for Pacific coral reef ecosystems
Erratum in
-
Correction: Quantifying Climatological Ranges and Anomalies for Pacific Coral Reef Ecosystems.PLoS One. 2021 May 6;16(5):e0251616. doi: 10.1371/journal.pone.0251616. eCollection 2021. PLoS One. 2021. PMID: 33956878 Free PMC article.
Abstract
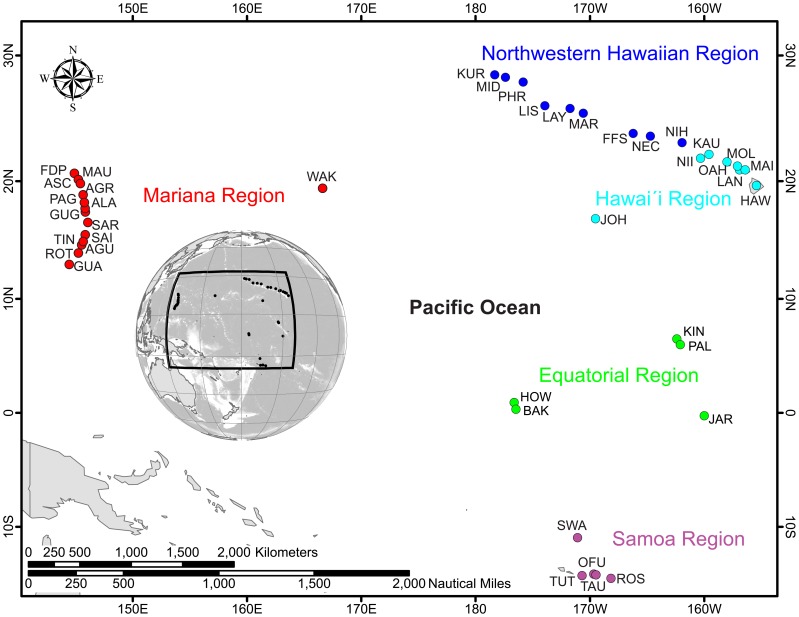
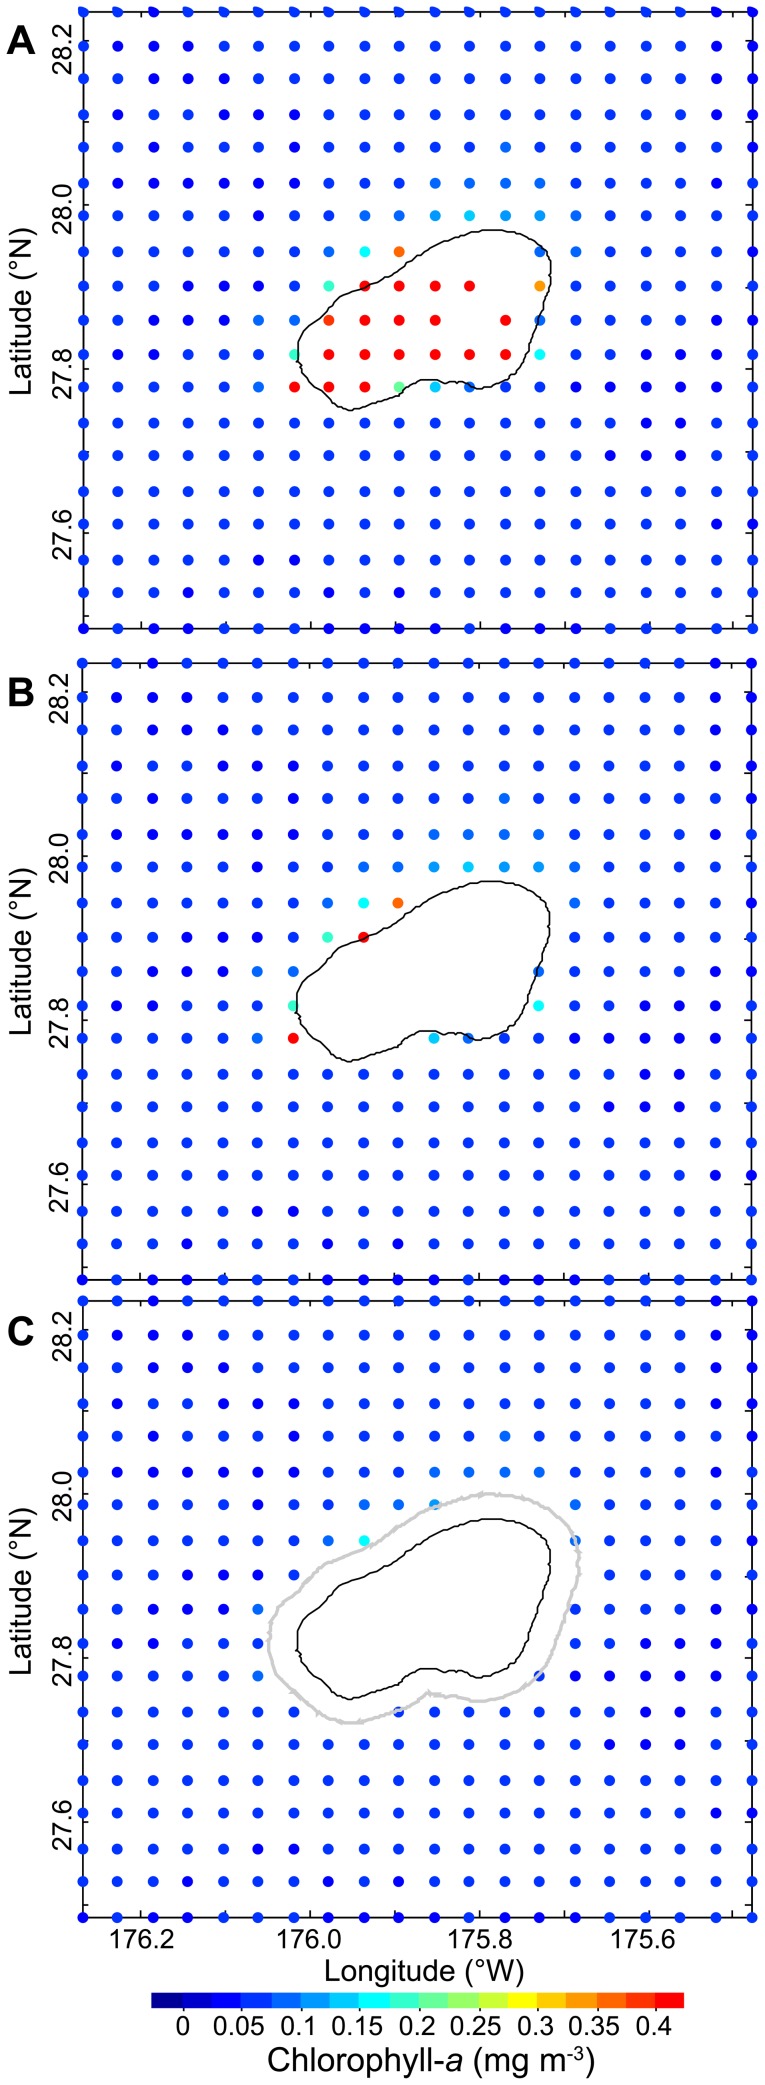
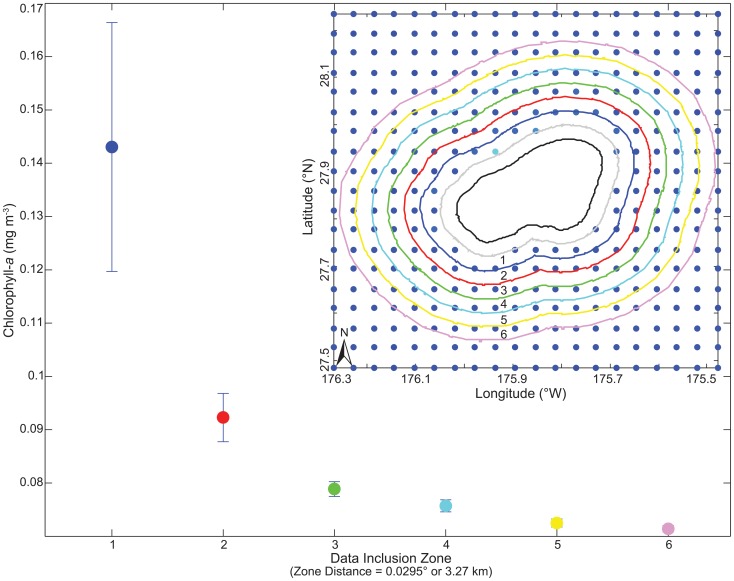
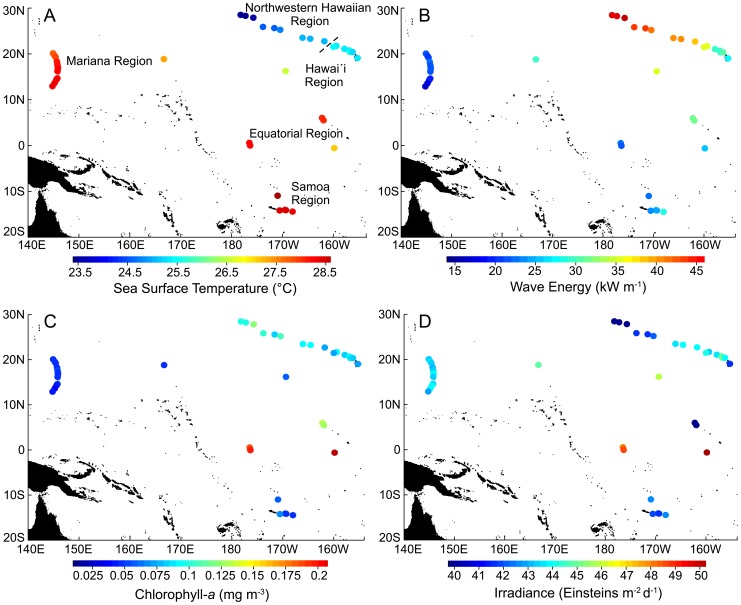
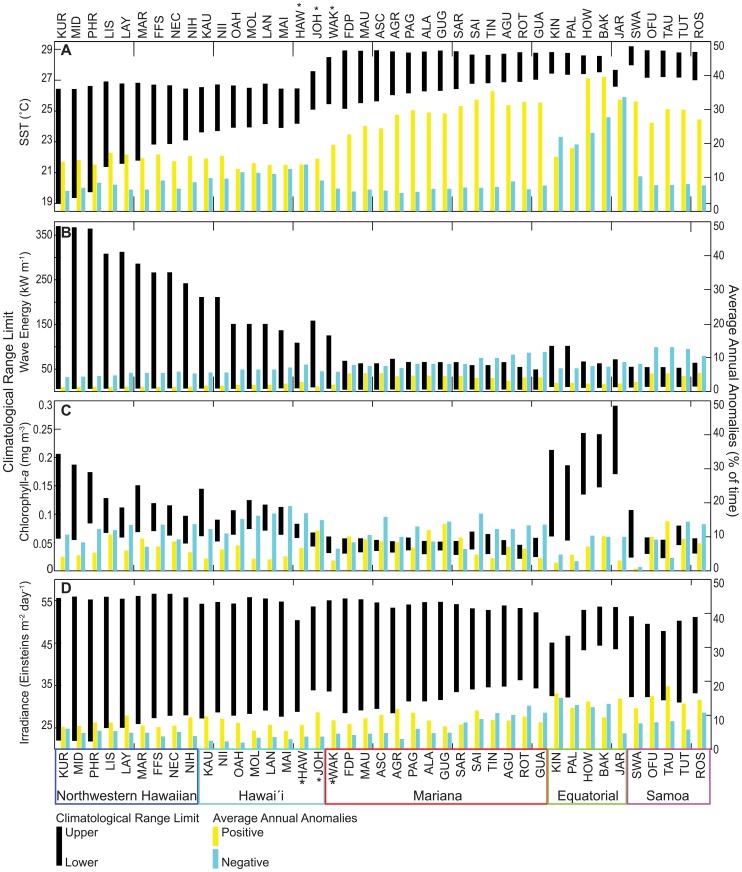
Coral reef ecosystems are exposed to a range of environmental forcings that vary on daily to decadal time scales and across spatial scales spanning from reefs to archipelagos. Environmental variability is a major determinant of reef ecosystem structure and function, including coral reef extent and growth rates, and the abundance, diversity, and morphology of reef organisms. Proper characterization of environmental forcings on coral reef ecosystems is critical if we are to understand the dynamics and implications of abiotic-biotic interactions on reef ecosystems. This study combines high-resolution bathymetric information with remotely sensed sea surface temperature, chlorophyll-a and irradiance data, and modeled wave data to quantify environmental forcings on coral reefs. We present a methodological approach to develop spatially constrained, island- and atoll-scale metrics that quantify climatological range limits and anomalous environmental forcings across U.S. Pacific coral reef ecosystems. Our results indicate considerable spatial heterogeneity in climatological ranges and anomalies across 41 islands and atolls, with emergent spatial patterns specific to each environmental forcing. For example, wave energy was greatest at northern latitudes and generally decreased with latitude. In contrast, chlorophyll-a was greatest at reef ecosystems proximate to the equator and northern-most locations, showing little synchrony with latitude. In addition, we find that the reef ecosystems with the highest chlorophyll-a concentrations; Jarvis, Howland, Baker, Palmyra and Kingman are each uninhabited and are characterized by high hard coral cover and large numbers of predatory fishes. Finally, we find that scaling environmental data to the spatial footprint of individual islands and atolls is more likely to capture local environmental forcings, as chlorophyll-a concentrations decreased at relatively short distances (>7 km) from 85% of our study locations. These metrics will help identify reef ecosystems most exposed to environmental stress as well as systems that may be more resistant or resilient to future climate change.
Conflict of interest statement
Figures

Similar articles
-
Assessing the potential effects of climate change on the morphodynamics of the tropical coral reef islands in the Gulf of Mannar, Indian Ocean.J Environ Manage. 2025 Feb;375:124122. doi: 10.1016/j.jenvman.2025.124122. Epub 2025 Jan 22. J Environ Manage. 2025. PMID: 39848183
-
Advancing the integration of spatial data to map human and natural drivers on coral reefs.PLoS One. 2018 Mar 1;13(3):e0189792. doi: 10.1371/journal.pone.0189792. eCollection 2018. PLoS One. 2018. PMID: 29494613 Free PMC article.
-
Subregional variation in cover and diversity of hard coral (Scleractinia) in the Western Province, Solomon Islands following an unprecedented global bleaching event.PLoS One. 2020 Nov 11;15(11):e0242153. doi: 10.1371/journal.pone.0242153. eCollection 2020. PLoS One. 2020. PMID: 33175873 Free PMC article.
-
Operationalizing resilience for adaptive coral reef management under global environmental change.Glob Chang Biol. 2015 Jan;21(1):48-61. doi: 10.1111/gcb.12700. Epub 2014 Sep 5. Glob Chang Biol. 2015. PMID: 25196132 Free PMC article. Review.
-
Synergies between local and climate-driven impacts on coral reefs in the Tropical Pacific: A review of issues and adaptation opportunities.Mar Pollut Bull. 2021 Mar;164:111922. doi: 10.1016/j.marpolbul.2020.111922. Epub 2021 Feb 22. Mar Pollut Bull. 2021. PMID: 33632532 Review.
Cited by
-
Energetic differences between bacterioplankton trophic groups and coral reef resistance.Proc Biol Sci. 2016 Apr 27;283(1829):20160467. doi: 10.1098/rspb.2016.0467. Proc Biol Sci. 2016. PMID: 27097927 Free PMC article.
-
Environmental conditions and herbivore biomass determine coral reef benthic community composition: implications for quantitative baselines.Coral Reefs. 2018;37(4):1157-1168. doi: 10.1007/s00338-018-01737-w. Epub 2018 Oct 4. Coral Reefs. 2018. PMID: 30930680 Free PMC article.
-
Natural bounds on herbivorous coral reef fishes.Proc Biol Sci. 2016 Nov 30;283(1843):20161716. doi: 10.1098/rspb.2016.1716. Proc Biol Sci. 2016. PMID: 27881745 Free PMC article.
-
Local human impacts interact with geography to drive benthic community depth zonation on contemporary coral reefs.Proc Biol Sci. 2025 Jun;292(2048):20241885. doi: 10.1098/rspb.2024.1885. Epub 2025 Jun 11. Proc Biol Sci. 2025. PMID: 40495816 Free PMC article.
-
Six Month In Situ High-Resolution Carbonate Chemistry and Temperature Study on a Coral Reef Flat Reveals Asynchronous pH and Temperature Anomalies.PLoS One. 2015 Jun 3;10(6):e0127648. doi: 10.1371/journal.pone.0127648. eCollection 2015. PLoS One. 2015. PMID: 26039687 Free PMC article.
References
-
- Brown BE (1997) Adaptations of Reef Corals to Physical Environmental Stress. In: Blaxter JHS, Southward AJ, editors. Advances in Marine Biology: Academic Press. pp. 221−299.
-
- Done TJ (1999) Coral community adaptability to environmental change at the scales of regions, reefs and reef zones. American Zoologist 39: 66–79.
-
- Kleypas JA, McManus JW, Menez LAB (1999) Environmental Limits to Coral Reef Development: Where Do We Draw the Line? American Zoologist 39: 146–159.
-
- McClanahan TR, Ateweberhan M, Graham NAJ, Wilson SK, Sebastián CR, et al. (2007) Western Indian Ocean coral communities: bleaching responses and susceptibility to extinction. Marine Ecology Progress Series 337: 1–13.
-
- Barton AD, Casey KS (2005) Climatological context for large-scale coral bleaching. Coral Reefs 24: 536–554.
Publication types
MeSH terms
Substances
LinkOut - more resources
Full Text Sources
Other Literature Sources
