. 2013 Apr 26;8(4):e62131.
doi: 10.1371/journal.pone.0062131. Print 2013.

Fooling the eyes: the influence of a sound-induced visual motion illusion on eye movements

Affiliations

Fooling the eyes: the influence of a sound-induced visual motion illusion on eye movements

Alessio Fracasso et al. PLoS One. .

Abstract

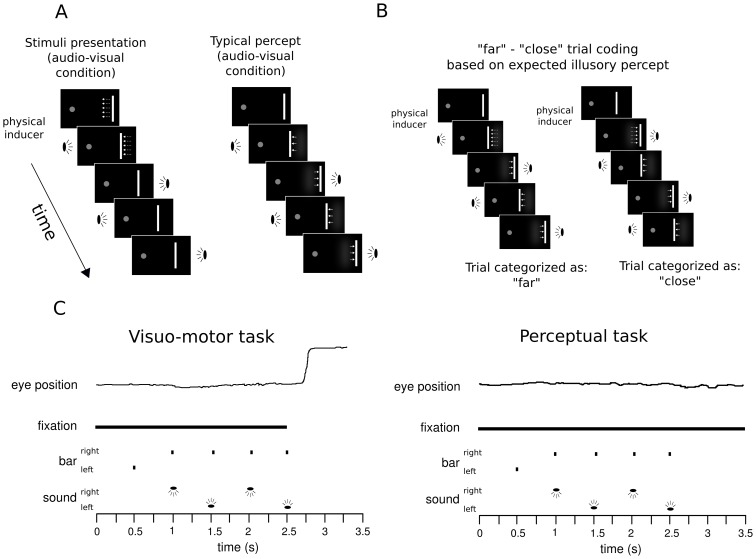
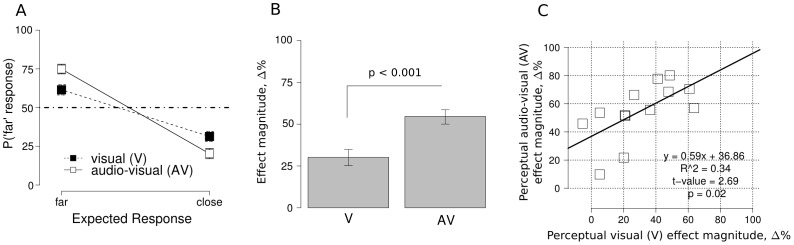
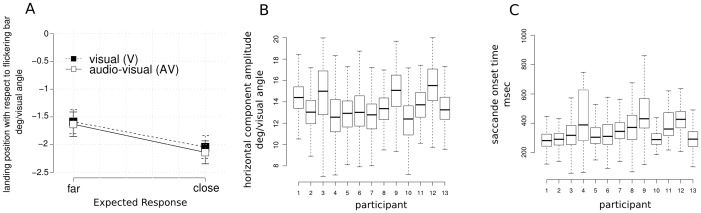
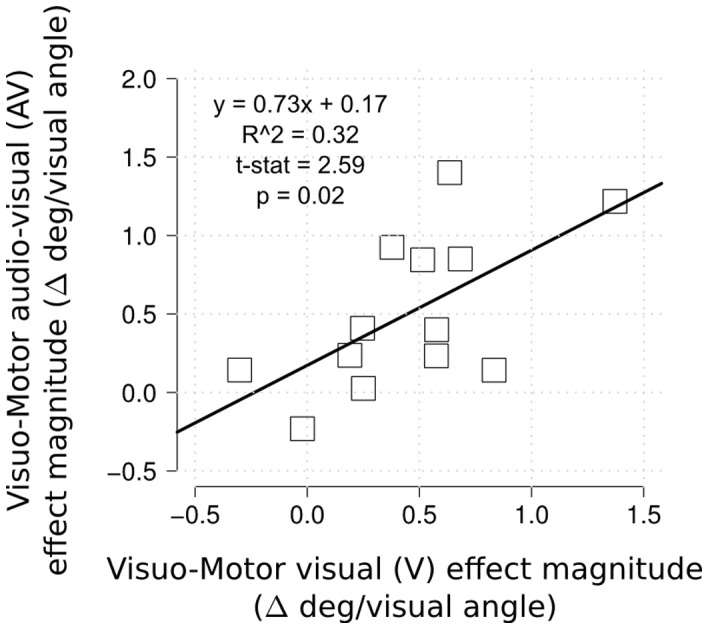
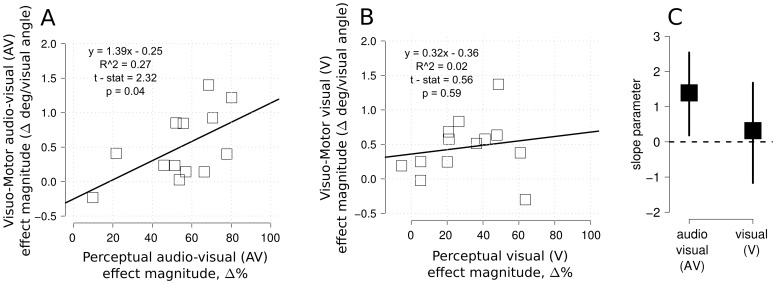
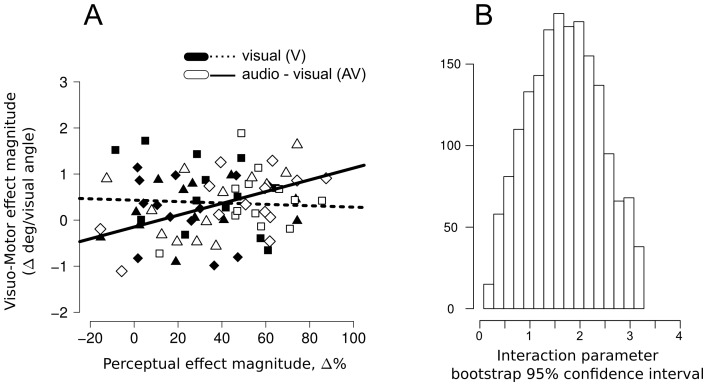
The question of whether perceptual illusions influence eye movements is critical for the long-standing debate regarding the separation between action and perception. To test the role of auditory context on a visual illusion and on eye movements, we took advantage of the fact that the presence of an auditory cue can successfully modulate illusory motion perception of an otherwise static flickering object (sound-induced visual motion effect). We found that illusory motion perception modulated by an auditory context consistently affected saccadic eye movements. Specifically, the landing positions of saccades performed towards flickering static bars in the periphery were biased in the direction of illusory motion. Moreover, the magnitude of this bias was strongly correlated with the effect size of the perceptual illusion. These results show that both an audio-visual and a purely visual illusion can significantly affect visuo-motor behavior. Our findings are consistent with arguments for a tight link between perception and action in localization tasks.


Conflict of interest statement

Competing Interests: The authors have declared that no competing interests exist.

Figures

Figure 1
Figure 1. Visual and auditory stimuli used during the experiment.
Panel A: stimuli presentation and typical percept for an audio-visual (AV), 5 bar repetition trial; between the first and second bar presentation a physical shift was introduced (see Procedure and Experimental Design), the remaining bars were presented always in the same position. Panel B: “far” and “close” trial coding based on the expected percept. Responses were coded as “far” and “close” as well. During the analysis phase the proportion of “far” responses for the visual-only and audio-visual condition and the expected response were analyzed (see “Data Analysis” section). Panel C: trial procedure for the visuo-motor and perceptual tasks for an audio-visual stimuli condition, along with typical eye movement traces. The visual-only condition was identical except that the sound was not provided. Each bar was presented for 100 ms with an ISI of 400 ms. In the visuo-motor task participants were instructed to perform an eye movement after the fixation point disappeared (50 ms before the last bar offset). In the perceptual task participants reported the perceived direction of the last bar (leftward vs. rightward).
Figure 2
Figure 2. Results of the perception task.
Panel A: the proportion of “far” responses for the two stimuli conditions (visual vs. audio-visual; V and AV) as a function of expected response. The steeper slope in the AV condition indicates a larger illusion effect (bars represent 2 SEM around the mean after normalization to remove between-subject variability [32]). Panel B: post hoc analysis representing effect magnitude in the V and AV condition. Magnitude in the latter condition is bigger than in the former, nonetheless V condition magnitude is consistently smaller but statistically different from chance (see results section; bars represent 2 SEM around the mean after normalization to remove between-subject variability [32]). Panel C: regression analysis in the perceptual task, the effect magnitude in the AV condition is positively correlated with magnitude in the V condition.
Figure 3
Figure 3. Visuo-motor modality ANOVA results.
Panel A: average horizontal (x) component offset from flickering bar position (0 in the y axis) across experimental condition. Data shows a significant influence of expected response condition (bars represent 2 SEM around the mean after normalization to remove between-subject variability [32]). Panels B and C: Boxplots showing single participant distribution of horizontal component amplitude and saccade onset time across all conditions.
Figure 4
Figure 4. Analysis of individual subject performance in the different tasks and conditions.
Data shows a strong correlation between the strength of the illusion in the two stimuli conditions (visual vs. audio-visual; V and AV) within the visuo-motor task.
Figure 5
Figure 5. Analysis of individual subject performance in different tasks and conditions.
Panel A: correlation between the visuo-motor and the perceptual response in the AV condition. Panel B: there was no correlation between the visuo-motor modality and perceptual modality in the visual condition (V). Panel C: 95% confidence interval bootstrapped slope parameter for the AV and V-only condition. Only in the former case the slope parameter was significantly above zero, whereas this was not the case in the V-only condition.
Figure 6
Figure 6. Bootstrapped robust linear regression links illusion magnitude in the perceptual and the visuo-motor domains.
Panel A: perceptual – visuo-motor relation binned across the 3 eccentricities for each participant (squares  = 15 deg/vis angle, diamonds  = 16 deg/vis angle, triangles  = 17deg/vis angle); audio-visual condition (white symbols, thick line): y = 1.24x−0.19, t(37) = 2.90 (slope parameter, p<0.05 based on 2000 bootstrapped repetitions), r2 = 0.57; visual-only condition (black symbols, dotted line): y = −0.15x+0.48, t(37) = −0.28 (slope parameter, ns based on 2000 bootstrapped repetitions), r2 = 0.08. Panel B: 95% confidence interval of interaction parameter between audio-visual and visual-only condition suggesting how the slope in the audio-visual condition is significantly different from the visual only-condition (mean bootstrapped interaction parameter  = 1.58).

Similar articles

Cited by

References

    1. Goodale MA, Milner AD, Jakobson LS, Carey DP (1991) A neurological dissociation between perceiving objects and grasping them. Nature 6305: 154–156. - PubMed
    1. Milner AD, Goodale MA (2008) Two visual systems re-viewed. Neuropsychologia 3: 774–785. - PubMed
    1. Westwood DA, Goodale MA (2011) Converging evidence for diverging pathways: neuropsychology and psychophysics tell the same story. Vision Res 8: 804–811. - PubMed
    1. Ganel T, Chajut E, Algom D (2008) Visual coding for action violates fundamental psychophysical principles. Curr Biol 14: R599–601. - PubMed
    1. Smeets JBJ, Brenner E (2008) Grasping weber's law. Curr Biol 23 : R1089-90; author reply R1090-1. - PubMed

Publication types

LinkOut - more resources