

Longitudinal MRI evaluation of intracranial development and vascular characteristics of breast cancer brain metastases in a mouse model
- PMID: 23638013
- PMCID: PMC3639286
- DOI: 10.1371/journal.pone.0062238
Longitudinal MRI evaluation of intracranial development and vascular characteristics of breast cancer brain metastases in a mouse model
Abstract
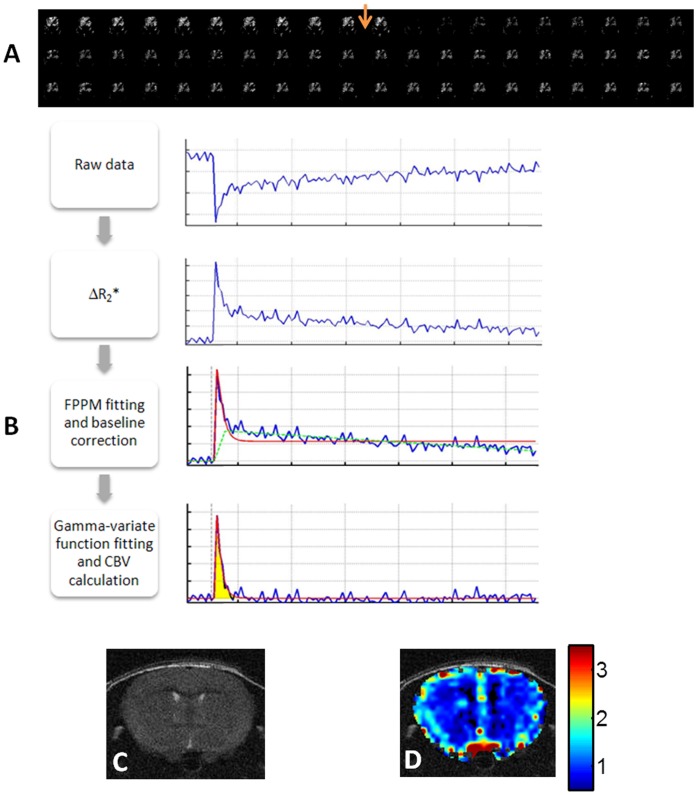
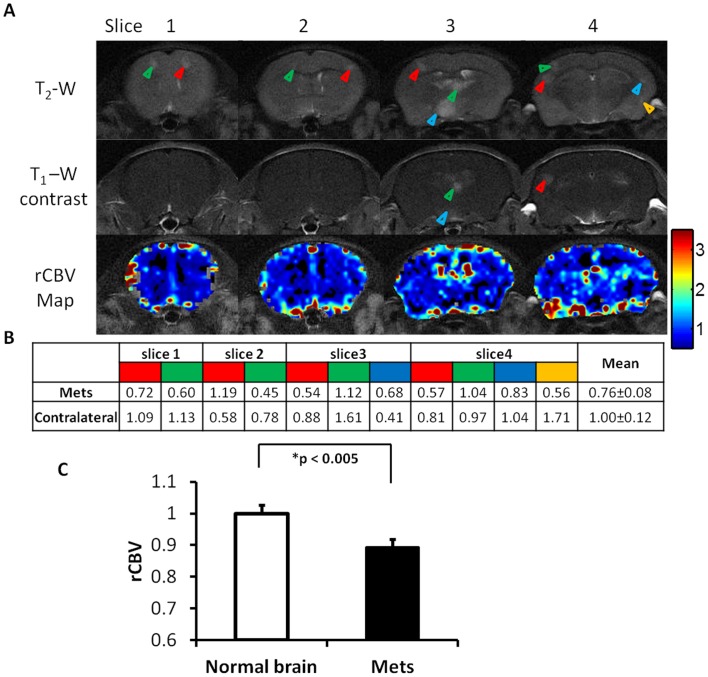
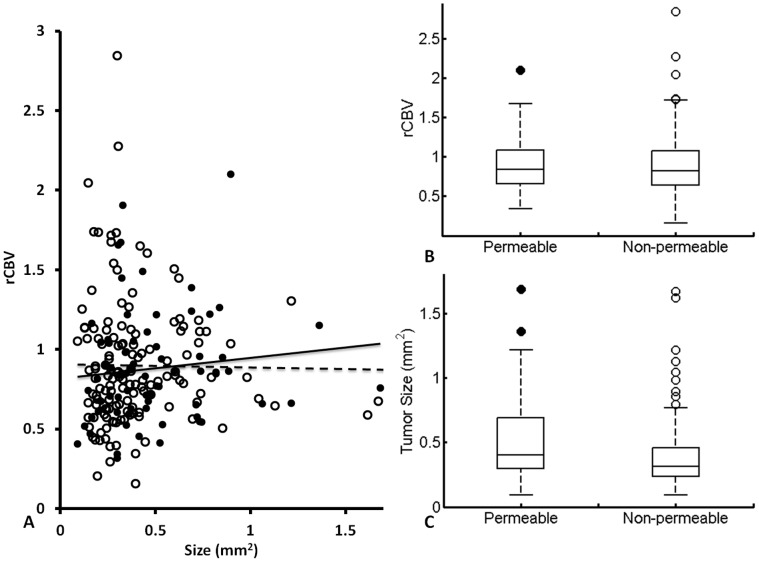
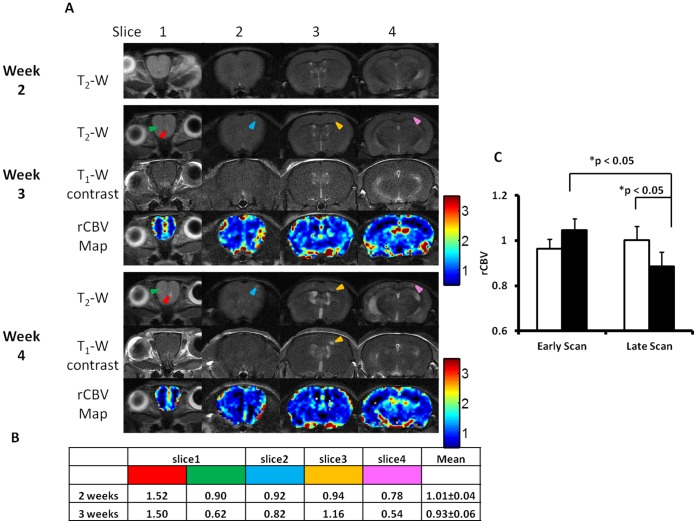
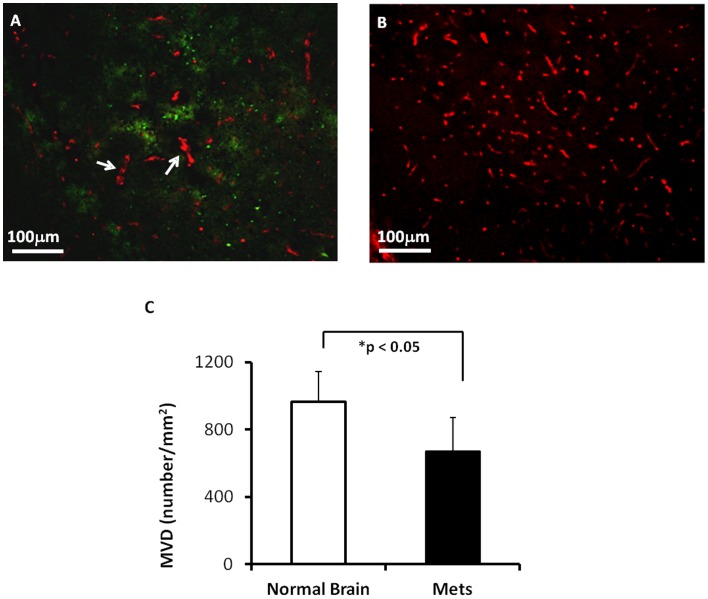
Longitudinal MRI was applied to monitor intracranial initiation and development of brain metastases and assess tumor vascular volume and permeability in a mouse model of breast cancer brain metastases. Using a 9.4T system, high resolution anatomic MRI and dynamic susceptibility contrast (DSC) perfusion MRI were acquired at different time points after an intracardiac injection of brain-tropic breast cancer MDA-MB231BR-EGFP cells. Three weeks post injection, multifocal brain metastases were first observed with hyperintensity on T2-weighted images, but isointensity on T1-weighted post contrast images, indicating that blood-tumor-barrier (BTB) at early stage of brain metastases was impermeable. Follow-up MRI revealed intracranial tumor growth and increased number of metastases that distributed throughout the whole brain. At the last scan on week 5, T1-weighted post contrast images detected BTB disruption in 160 (34%) of a total of 464 brain metastases. Enhancement in some of the metastases was only seen in partial regions of the tumor, suggesting intratumoral heterogeneity of BTB disruption. DSC MRI measurements of relative cerebral blood volume (rCBV) showed that rCBV of brain metastases was significantly lower (mean= 0.89±0.03) than that of contralateral normal brain (mean= 1.00±0.03; p<0.005). Intriguingly, longitudinal measurements revealed that rCBV of individual metastases at early stage was similar to, but became significantly lower than that of contralateral normal brain with tumor growth (p<0.05). The rCBV data were concordant with histological analysis of microvascular density (MVD). Moreover, comprehensive analysis suggested no significant correlation among tumor size, rCBV and BTB permeability. In conclusion, longitudinal MRI provides non-invasive in vivo assessments of spatial and temporal development of brain metastases and their vascular volume and permeability. The characteristic rCBV of brain metastases may have a diagnostic value.
Conflict of interest statement
Figures

Similar articles
-
MRI evaluation of the effects of whole brain radiotherapy on breast cancer brain metastasis.Int J Radiat Biol. 2019 Mar;95(3):338-346. doi: 10.1080/09553002.2019.1554920. Epub 2019 Jan 7. Int J Radiat Biol. 2019. PMID: 30499763 Free PMC article.
-
Ultrasound imaging-guided intracardiac injection to develop a mouse model of breast cancer brain metastases followed by longitudinal MRI.J Vis Exp. 2014 Mar 6;(85):51146. doi: 10.3791/51146. J Vis Exp. 2014. PMID: 24637963 Free PMC article.
-
Dynamic susceptibility contrast (DSC) perfusion MRI in differential diagnosis between radionecrosis and neoangiogenesis in cerebral metastases using rCBV, rCBF and K2.Radiol Med. 2018 Jul;123(7):545-552. doi: 10.1007/s11547-018-0866-7. Epub 2018 Mar 5. Radiol Med. 2018. PMID: 29508242
-
The advantage of high relaxivity contrast agents in brain perfusion.Eur Radiol. 2006 Nov;16 Suppl 7:M16-26. doi: 10.1007/s10406-006-0192-3. Eur Radiol. 2006. PMID: 18655263 Review.
-
Brain metastases from breast cancer: lessons from experimental magnetic resonance imaging studies and clinical implications.J Mol Med (Berl). 2014 Jan;92(1):5-12. doi: 10.1007/s00109-013-1108-z. Epub 2013 Dec 5. J Mol Med (Berl). 2014. PMID: 24306136 Review.
Cited by
-
EPMA position paper in cancer: current overview and future perspectives.EPMA J. 2015 Apr 15;6(1):9. doi: 10.1186/s13167-015-0030-6. eCollection 2015. EPMA J. 2015. PMID: 25908947 Free PMC article.
-
Ex vivo Evans blue assessment of the blood brain barrier in three breast cancer brain metastasis models.Breast Cancer Res Treat. 2014 Feb;144(1):93-101. doi: 10.1007/s10549-014-2854-5. Epub 2014 Feb 8. Breast Cancer Res Treat. 2014. PMID: 24510011 Free PMC article.
-
Novel human melanoma brain metastasis models in athymic nude fox1nu mice: Site-specific metastasis patterns reflecting their clinical origin.Cancer Med. 2021 Dec;10(23):8604-8613. doi: 10.1002/cam4.4334. Epub 2021 Oct 6. Cancer Med. 2021. PMID: 34612023 Free PMC article.
-
Preclinical Models of Brain Metastases in Breast Cancer.Biomedicines. 2022 Mar 13;10(3):667. doi: 10.3390/biomedicines10030667. Biomedicines. 2022. PMID: 35327469 Free PMC article. Review.
-
Transfer Learning Approach to Vascular Permeability Changes in Brain Metastasis Post-Whole-Brain Radiotherapy.Cancers (Basel). 2023 May 10;15(10):2703. doi: 10.3390/cancers15102703. Cancers (Basel). 2023. PMID: 37345039 Free PMC article.
References
-
- Schouten LJ, Rutten J, Huveneers HA, Twijnstra A (2002) Incidence of brain metastases in a cohort of patients with carcinoma of the breast, colon, kidney, and lung and melanoma. Cancer 94: 2698–2705. - PubMed
-
- Lin NU, Bellon JR, Winer EP (2004) CNS metastases in breast cancer. J Clin Oncol 22: 3608–3617. - PubMed
-
- Jemal A, Siegel R, Xu J, Ward E (2010) Cancer Statistics, 2010. CA Cancer J Clin 60: 277–300. - PubMed
-
- Hurwitz H, Fehrenbacher L, Novotny W, Cartwright T, Hainsworth J, et al. (2004) Bevacizumab plus irinotecan, fluorouracil, and leucovorin for metastatic colorectal cancer. N Engl J Med 350: 2335–2342. - PubMed
Publication types
MeSH terms
Grants and funding
LinkOut - more resources
Full Text Sources
Other Literature Sources
Medical
