. 2013 Apr 29;8(4):e62304.
doi: 10.1371/journal.pone.0062304. Print 2013.

Nuclear localization of CD26 induced by a humanized monoclonal antibody inhibits tumor cell growth by modulating of POLR2A transcription

Affiliations

Nuclear localization of CD26 induced by a humanized monoclonal antibody inhibits tumor cell growth by modulating of POLR2A transcription

Kohji Yamada et al. PLoS One. .

Abstract

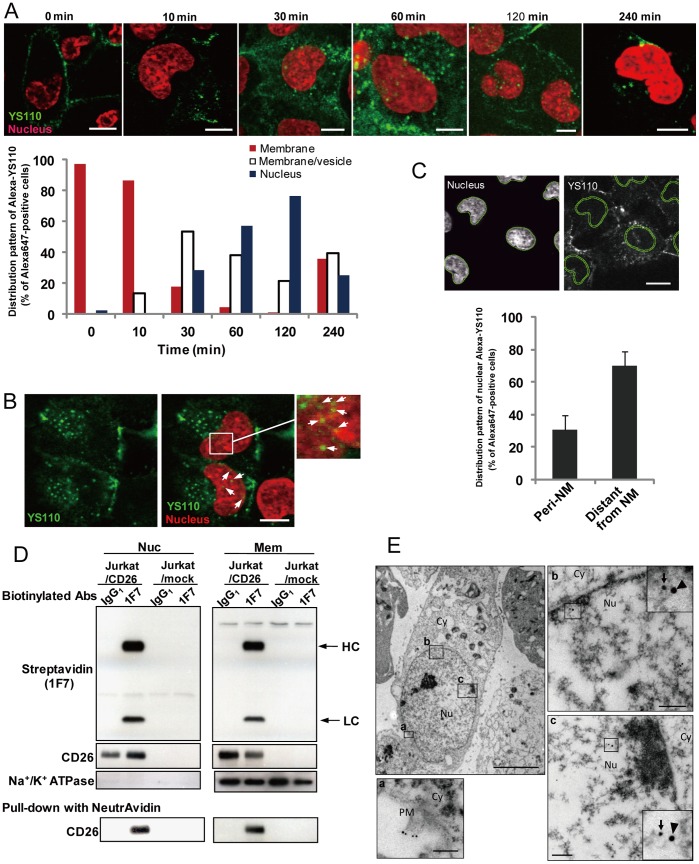
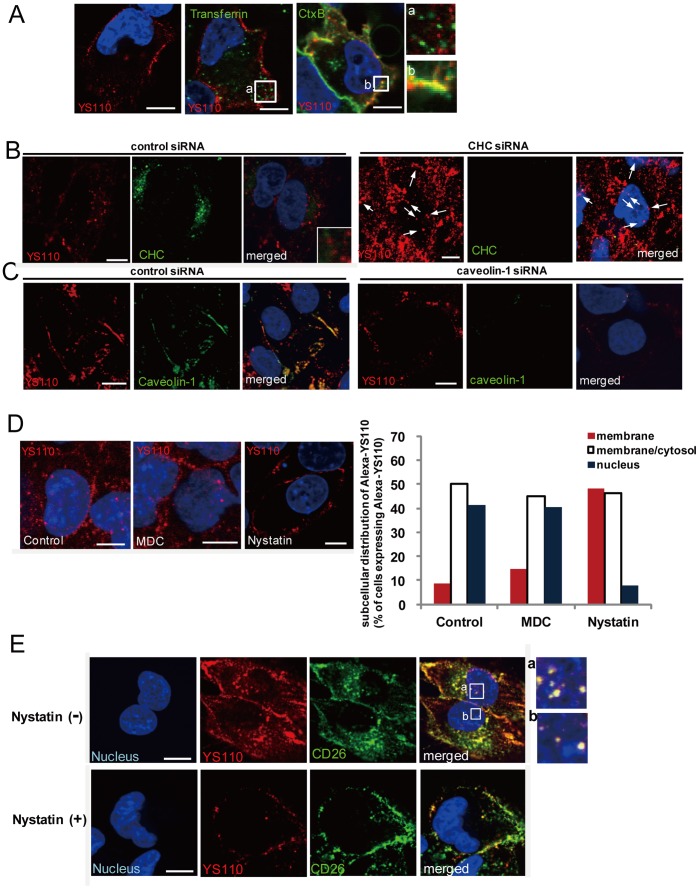
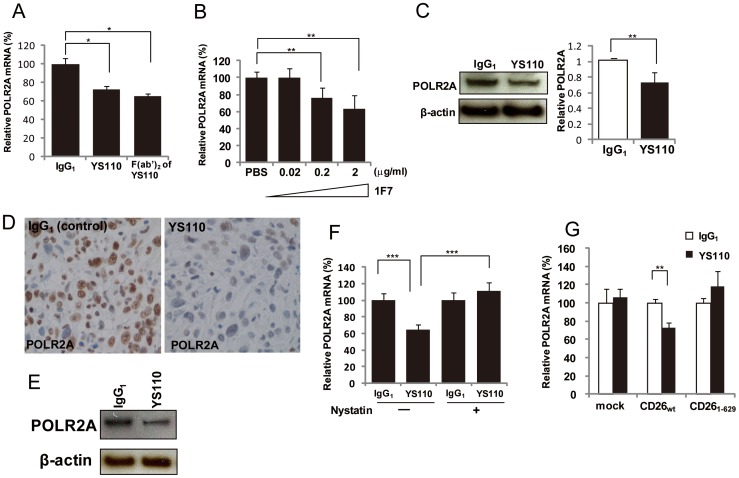
CD26 is a type II glycoprotein known as dipeptidyl peptidase IV and has been identified as one of the cell surface markers associated with various types of cancers and a subset of cancer stem cells. Recent studies have suggested that CD26 expression is involved in tumor growth, tumor invasion, and metastasis. The CD26 is shown in an extensive intracellular distribution, ranging from the cell surface to the nucleus. We have previously showed that the humanized anti-CD26 monoclonal antibody (mAb), YS110, exhibits inhibitory effects on various cancers. However, functions of CD26 on cancer cells and molecular mechanisms of impaired tumor growth by YS110 treatment are not well understood. In this study, we demonstrated that the treatment with YS110 induced nuclear translocation of both cell-surface CD26 and YS110 in cancer cells and xenografted tumor. It was shown that the CD26 and YS110 were co-localized in nucleus by immunoelectron microscopic analysis. In response to YS110 treatment, CD26 was translocated into the nucleus via caveolin-dependent endocytosis. It was revealed that the nuclear CD26 interacted with a genomic flanking region of the gene for POLR2A, a subunit of RNA polymerase II, using a chromatin immunoprecipitation assay. This interaction with nuclear CD26 and POLR2A gene consequently led to transcriptional repression of the POLR2A gene, resulting in retarded cell proliferation of cancer cells. Furthermore, the impaired nuclear transport of CD26 by treatment with an endocytosis inhibitor or expressions of deletion mutants of CD26 reversed the POLR2A repression induced by YS110 treatment. These findings reveal that the nuclear CD26 functions in the regulation of gene expression and tumor growth, and provide a novel mechanism of mAb-therapy related to inducible translocation of cell-surface target molecule into the nucleus.


Conflict of interest statement

Competing Interests: The authors have declared that no competing interests exist.

Figures

Figure 1
Figure 1. Nuclear Translocation of Antitumor CD26 mAbs in Cancer Cells.
(A) JMN cells were treated with Alexa647-labeled YS110 (Alexa-YS110) for the indicated time periods before fixation. The distribution of Alexa-YS110 in the fixed cells was observed by confocal fluorescence microscopy (upper panels). To quantitate these observations, fixed JMN cells retaining Alexa-YS110 were categorized into three types : the cell containing YS110 predominantly observed on the cell surface (red bar); the cell containing Alexa-YS110 present on both the cell surface and in cytosolic vesicles (white bar); the cell containing Alexa-YS110 observed in the nucleus (blue bar). The categorization was performed by confocal fluorescence microscopy of more than 50 cells for each incubation time (lower panel). Scale bars, 10 µm. (B) Immunofluorescence staining with antibody to human IgG1 in fixed JMN cells, following YS110 treatment for 1 hour, and staining with Hoechst 33342. Localization of YS110 (green) in the nucleus (red) appears as yellow, as indicated by arrows. Scale bars, 10 µm. (C) Identification of the nuclear membrane (NM) was performed using TissueQuest software. The distribution of Alexa-YS110 in the nucleus was subdivided into two categories: close to (within 1 µm; peri-NM) or distant from NM, in JMN cells treated with Alexa-YS110 for 2 hours. Data are means ± SD for more than 20 cells. Scale bar, 10 µm. (D) Jurkat/mock or Jurkat/CD26 cells were incubated with biotin-labeled control IgG1 or 1F7 for 1 hour. Nuclear (Nuc) and membrane (Mem) extracts of these cells were pulled-down with Neutravidin, and then subjected to immunoblot analysis using streptavidin or antibodies to CD26 or Na+/K+ ATPase (membrane marker). HC, heavy chain; LC, light chain. (E) Immunogold labeling for CD26 and YS110 on ultrathin sections demonstrated the localization of these proteins in JMN cells. The arrow and arrowhead indicate CD26 (15 nm) and YS110 (30 nm) in the plasma membrane (a) and the nucleus (b and C), respectively. Scale bars, 5 µm and 200 nm (a, b and c). PM, plasma membrane; Cy, cytoplasm; Nu, nucleus.
Figure 2
Figure 2. Anti-CD26 mAbs Enhance Nuclear Localization of CD26.
(A) Nuclear (Nuc), cytoplasmic (Cyto), and membrane (Mem) fractions of MSTO cells stably transfected with empty vector (mock) or CD26 (clone8 and clone12) were prepared (Qiagen kit), immunoprecipitated with 1F7, and subjected to immunoblot analysis. Nuclear (Nuc) and cytosolic (Cyto) fractions of tumors from two malignant mesothelioma patients were prepared (Thermo kit), and subjected to immunoblot analysis. Lamin A/C, Calpain 1/2, and PDC-E2 and Na+/K+ ATPase were used as nuclear, cytoplasmic and membrane markers, respectively. (B) Immunogold staining of CD26 (15 nm gold particles, arrows) in ultrathin sections of JMN cells. Cyto, cytoplasm; Nu, nucleus. Scale bar, 200 nm. (C) Immunoblot analysis of CD26 in nuclear and cytosolic fractions of JMN cells treated with YS110 for the indicated times. Na+/K+ ATPase and Lamin A/C were used as cytosolic and the nuclear markers, respectively. (D) Diagram of each CD26 deletion mutant (left picture). CD26 contains a cytoplasmic domain (amino acids 1–6), a transmembrane domain (TM) (amino acids 7–29), a glycosylated domain (GD) (amino acids 85–321), and a dipeptidyl peptidase IV domain (DPPIV) (amino acids 627–740). Human embryonic kidney (HEK) 293 cells transiently expressing each flag-tagged construct were subjected to subcellular fractionation and immunoblot analysis with antibodies to Flag and nucleostemin (as a nuclear marker). (E) Immunofluorescence analysis of HeLa cells transfected with GFP-CD26wt or GFP-CD261–629 and treated or not treated with Alexa-YS110 for 1 hour. In the merged image, GFP-fused proteins are shown in green, Alexa-YS110 is shown in red, and the nucleus is shown in blue. Arrows indicate colocalization of Alexa-YS110 and CD26wt in the nucleus. Scale bars, 10 µm.
Figure 3
Figure 3. Caveolin-Dependent Endocytosis Mediates the Nuclear Translocation of CD26 and YS110.
(A) JMN cells were incubated with Alexa-YS110 and PBS, Alexa488-Transferrin (Alexa-Tf), or Alexa488-Cholera toxin B (Alexa-CtxB) for 5 minutes In the merged images, YS110 is shown in red, the tracers are shown in green, and the nucleus is shown in blue. Colocalization of YS110 and the respective tracer appears as yellow. The boxed region in the panels shows localization of Alexa-YS110 and Alexa-Tf (a) or Alexa-CtxB (b) at high magnification. Scale bars, 10 µm. (B) JMN cells were treated with siRNA for non-silencing (NS) or siRNA for clathrin heavy chain (CHC). Images show immunofluorescence staining for YS110 (red), clathrin heavy chain (CHC, green) and Hoechst 33342 (blue) in fixed JMN cells, following Alexa-YS110 treatment for 30 minutes. Scale bars, 10 µm. (C) JMN cells were treated with siRNA for NS or siRNA for caveolin-1. Images show immunofluorescence staining for YS110 (red), caveolin-1 (green) and Hoechst 33342 (blue) in fixed JMN cells, following Alexa-YS110 treatment for 30 minutes. Scale bars, 10 µm. (D) JMN cells were pre-treated with dimethyl sulfoxide (DMSO), monodansylcadaverin (MDC) (250 µM), or nystatin (50 µg/mL) for 30 minutes, and then stimulated with Alexa-YS110 for 30 minutes. Quantification of the number of cells in which Alexa-YS110 was localized on the cell surface (membrane), in the cytosol (membrane/cytosol), and in the nucleus (nucleus), was performed by confocal fluorescence microscopy of more than 50 cells for each incubation time (right panel). Scale bars, 10 µm. (E) JMN cells were pretreated with or without nystatin prior to incubation with Alexa-YS110 for 30 minutes. In the merged images, YS110 is shown in red, CD26 is shown in green, and the nucleus is shown in blue. Colocalization of YS110 and CD26 in the nucleus appears as white in the boxed region (a and b). Scale bars, 10 µm.
Figure 4
Figure 4. YS110 and CD26 Translocate to the Nucleus In Vivo.
H&E staining (A and F) and fluorescence analysis (B–E and G–J) of malignant mesothelioma tumors in NOG mice inoculated with JMN cells were shown. These tumors were removed 6 hours after one intratumoral injection (1 µg/a tumor, volume is 100 µL) of Alexa647-human IgG1 (A–E) or Alexa647-YS110 (F–J). In the overlaid image, CD26 expression is indicated in red (B, D, G, and I), Alexa647-labeled antibodies are shown in green (C, D, H and I), and the nucleus is shown in blue (D and I). Colocalization of CD26 and YS110 in the nucleus appears as white (I, arrows). This localization of Alexa647-labeled antibody (green) in the nucleus (red) is confirmed as yellow (arrows) (J). Similar results were obtained with three different mice. Scale bars, 20 µm (A and F) and 10 µm (B–E and G–J).
Figure 5
Figure 5. Nuclear CD26 Associates with a POLR2A-Related Genome Sequence Following YS110 Treatment.
(A) Schematic diagram of chromatin immunoprecipitation (ChIP) cloning. JMN cells pretreated with YS110 for 3 hours were fixed, sonicated, and immunoprecipitated with Dynabeads to collect YS110-CD26-DNA complexes. The DNA fragments were cloned and identified by sequencing. The identity of candidate sequences was confirmed using data from GeneBank. (B) Genomic location of the CAS162 sequence. The 129-bp CAS162 sequence is located 894 bp downstream from the POLR2A gene. (C) ChIP analysis of CAS162 in JMN cells treated with control human IgG1 or YS110 for 3 hours. Similar results were obtained in three independent experiments. (D) Biotin-labeled CAS162 oligonucleotide was used for electrophoretic mobility shift assay (EMSA). Nuclear extract (NE) was also collected from JMN cells pretreated with YS110 for 3 hours. After 20 minutes at room temperature the extracts, with or without recombinant CD26, were subjected to immunoblot analysis with streptavidin. Non-biotinylated CAS162 was used as a competitor. Arrow indicates the CD26-CAS162 oligonucleotide complex. (E) Biotin-labeled CAS162 oligonucleotide was used for EMSA. NE was collected from JMN cells. After 20 minutes at room temperature the extracts, with or without antibodies, were subjected to immunoblot analysis with streptavidin. Arrow indicates the CD26-CAS162 oligonucleotide complex. YS, YS110; Ig, IgG1. (F) MSTO (mock or CD26wt) cells were co-transfected with empty vector (pGL3) or CAS162 and phRL-TK, and relative luciferase activity was measured using a luminometer. Data were normalized for luciferase activity in cells transfected with phRL-TK, and are presented as mean values (± SD) from three independent experiments. *P<0.025. (G) JMN cells co-transfected with pGL3 or CAS162 and phRL-TK vector were incubated with control IgG1 or YS110, and relative luciferase activity was measured using a luminometer. Data were normalized for luciferase activity in JMN cells transfected with phRL-TK, and are presented as mean values (± SD) from three independent experiments. *P<0.025.
Figure 6
Figure 6. Nuclear Translocation of CD26 After Treatment with YS110 or 1F7 Suppresses POLR2A Expression.
(A) Quantitative RT-PCR analysis of POLR2A mRNA in JMN cells treated with YS110 or YS110-F(ab’)2 (2 µg/mL) for 3 hours, relative to that in JMN cells treated with control human IgG1. Data were normalized to glyceraldehyde-3-phosphate dehydrogenase (GAPDH) mRNA levels and are means ± SD from three independent experiments. *P<0.01. (B) Quantitative RT-PCR analysis of POLR2A mRNA in JMN cells treated with 1F7 (0.02, 0.2, or 2 µg/mL) for 3 hours, relative to that in JMN cells treated with IgG1. Data were normalized to GAPDH mRNA levels and are means ± SD from three independent experiments. **P<0.025. (C) Upper panels show immunoblot analysis of POLR2A and β-actin (loading control) in lysates of JMN cells treated with control IgG1 or YS110 (2 µg/mL) for 3 hours. Lower panel shows mean values (± SD) from three independent experiments, for intensity of the POLR2A band in cells treated with YS110, relative to that in cells treated with control IgG1. (D) Immunostaining for POLR2A of tumors from NOG mice inoculated with JMN cells, followed by one intratumoral injection of control IgG1 or YS110 (1 µg/a tumor, volume is 100 µL). Scale bars, 20 µm. (E) Immunoblot of POLR2A and β-actin (loading control) in lysates of tumors from NOG mice inoculated with JMN cells, followed by one intratumoral injection of control IgG1 or YS110 (1 µg/a tumor, volume is 100 µL). (F) Quantitative RT-PCR analysis of POLR2A mRNA in JMN cells treated with human control IgG1 or YS110 (2 µg/mL) for 3 hours, after pretreatment with DMSO or nystatin (50 µg/mL) for 30 minutes. Data were normalized to GAPDH mRNA levels and are means ± SD from three independent experiments. ***P<0.005. (G) Quantitative RT-PCR analysis of POLR2A mRNA in Li7 cells transfected with control, CD26wt, or CD261–629 constructs, following treatment with human control IgG1 or YS110 (2 µg/mL) for 3 hours. Data were normalized to GAPDH mRNA levels and are means ± SD from three independent experiments. **P<0.025.
Figure 7
Figure 7. Knock-Down of the POLR2A Gene Inhibits Cell Growth in JMN Cells.
(A) Immunostaining of POLR2A in tumors from malignant mesothelioma patients. Scale bar, 20 µm. (B) Immunostaining of POLR2A in tumors from NOG mice inoculated with MSTO/CD26 cells. Scale bar, 20 µm. (C) Immunoblot analysis of POLR2A in JMN cells transfected with a non-specific (NS) control siRNA or POLR2A siRNA (oligo 1 or oligo 2). β-actin was used as a loading control. KD, knock-down. (D) Numbers of viable JMN cells transfected with POLR2A siRNA (oligo 1 or oligo 2) for 48 hours, relative into the numbers of viable cells transfected with NS control siRNA, were measured using the water soluble, 2-(2-methoxy-4-nitrophenyl)-3-(4-nitrophenyl)-5-(2,4-disulfophenyl)-2H-tetrazolium (WST)-8 assay. Data are means ± SD from three independent experiments. *P<0.004. (E) Model for POLR2A suppression by YS110-induced nuclear CD26. Cell surface CD26 is translocated to the nucleus in response to YS110 treatment, and binds to genomic DNA associated with the POLR2A gene. This results in transcriptional suppression of POLR2A and consequent inhibition of cell growth.

References

    1. Rasmussen HB, Branner S, Wiberg FC, Wagtmann N (2003) Crystal structure of human dipeptidyl peptidase IV/CD26 in complex with a substrate analog. Nat Struct Biol 10: 19–25. - PubMed
    1. Drucker DJ, Nauck MA (2006) The incretin system: glucagon-like peptide-1 receptor agonists and dipeptidyl peptidase-4 inhibitors in type 2 diabetes. Lancet 368: 1696–1705. - PubMed
    1. Havre PA, Abe M, Urasaki Y, Ohnuma K, Morimoto C, et al. (2008) The role of CD26/dipeptidyl peptidase IV in cancer. Front Biosci 13: 1634–1645. - PubMed
    1. Inamoto T, Yamada T, Ohnuma K, Kina S, Takahashi N, et al. (2007) Humanized anti-CD26 monoclonal antibody as a treatment for malignant mesothelioma tumors. Clin Cancer Res 13: 4191–4200. - PubMed
    1. Pang R, Law WL, Chu AC, Poon JT, Lam CS, et al. (2010) A subpopulation of CD26+ cancer stem cells with metastatic capacity in human colorectal cancer. Cell Stem Cell 6: 603–615. - PubMed

Publication types

MeSH terms

Substances