. 2013 Apr 24;8(4):e62417.
doi: 10.1371/journal.pone.0062417. Print 2013.

Antibody to ricin a chain hinders intracellular routing of toxin and protects cells even after toxin has been internalized

Affiliations

Antibody to ricin a chain hinders intracellular routing of toxin and protects cells even after toxin has been internalized

Kejing Song et al. PLoS One. .

Abstract

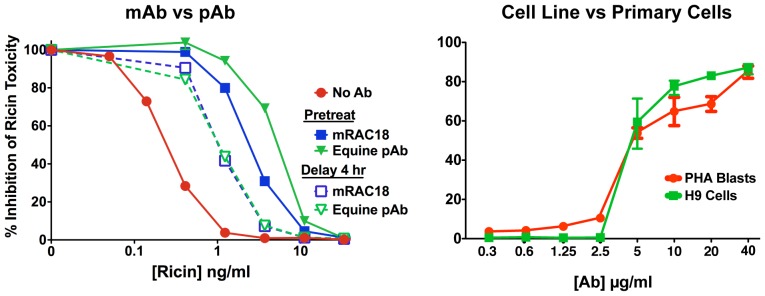
Background: Mechanisms of antibody-mediated neutralization are of much interest. For plant and bacterial A-B toxins, A chain mediates toxicity and B chain binds target cells. It is generally accepted and taught that antibody (Ab) neutralizes by preventing toxin binding to cells. Yet for some toxins, ricin included, anti-A chain Abs afford greater protection than anti-B. The mechanism(s) whereby Abs to the A chain neutralize toxins are not understood.

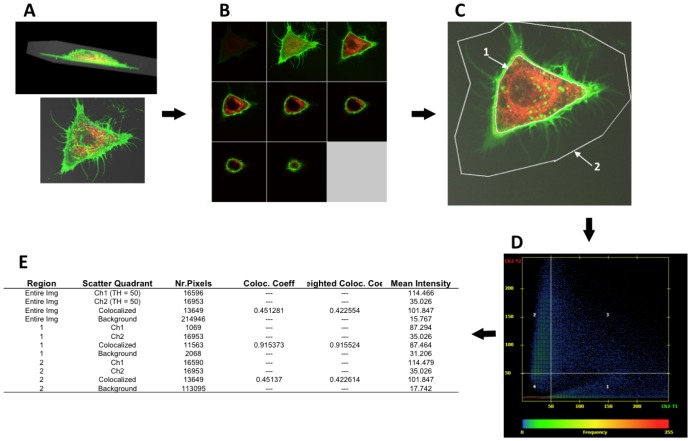
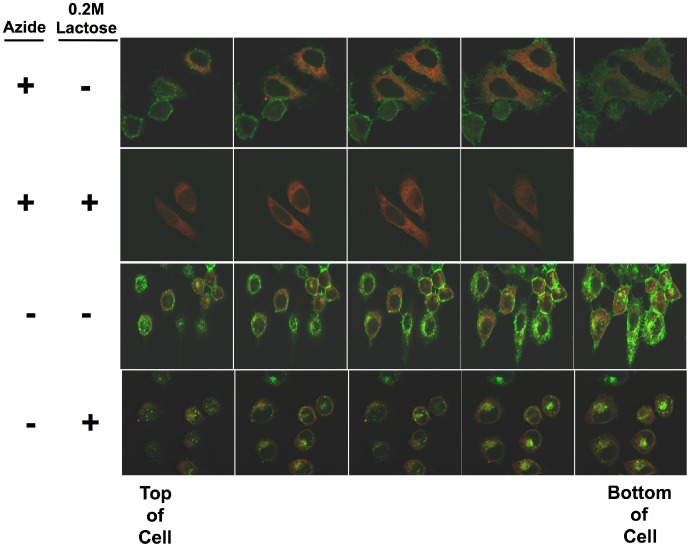
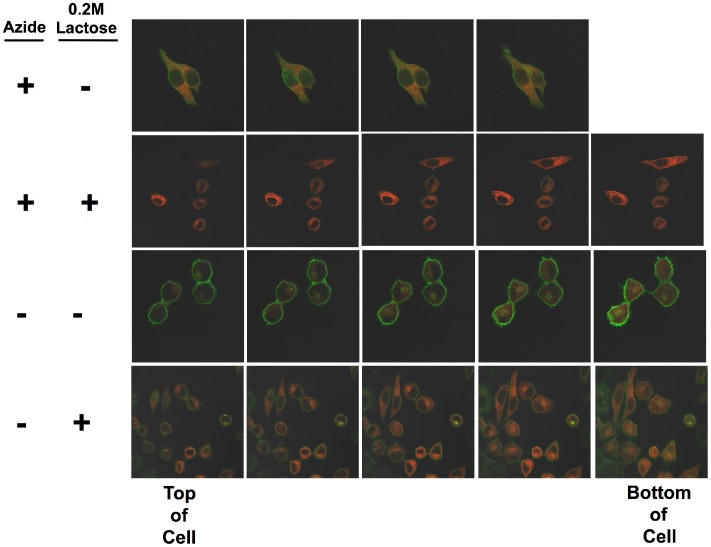
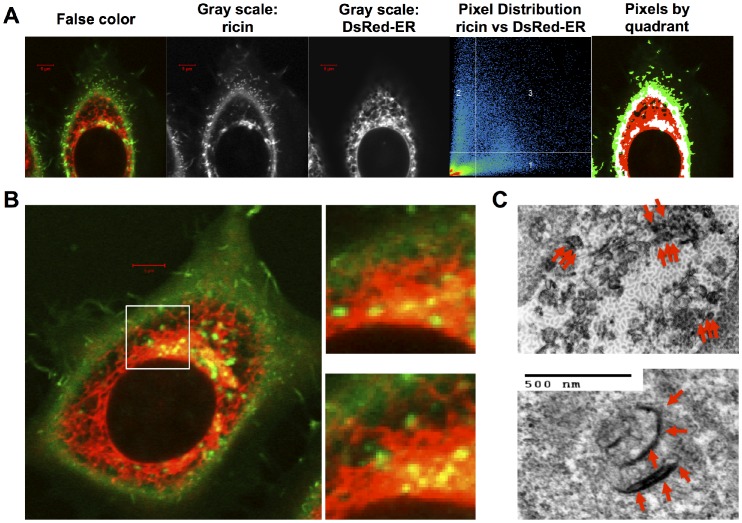
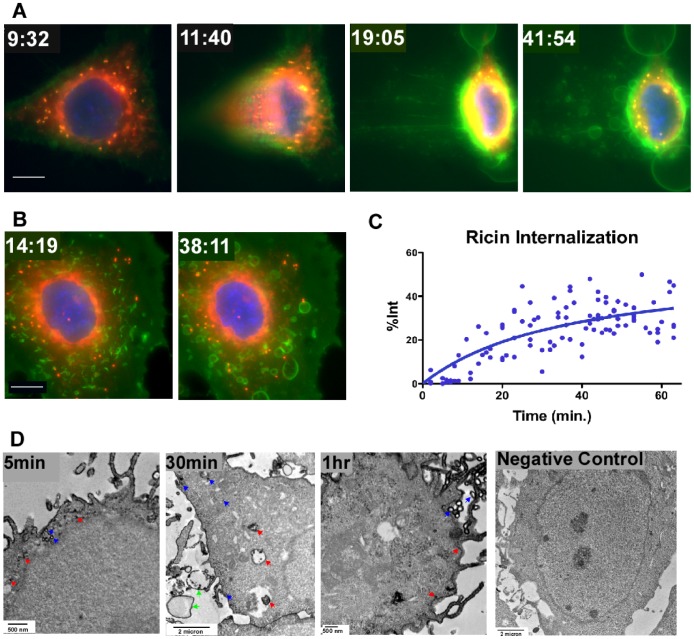
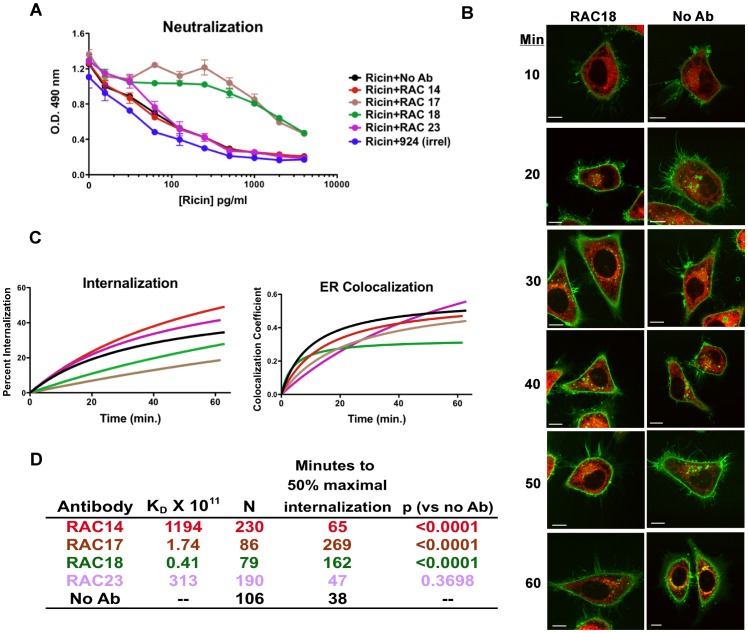
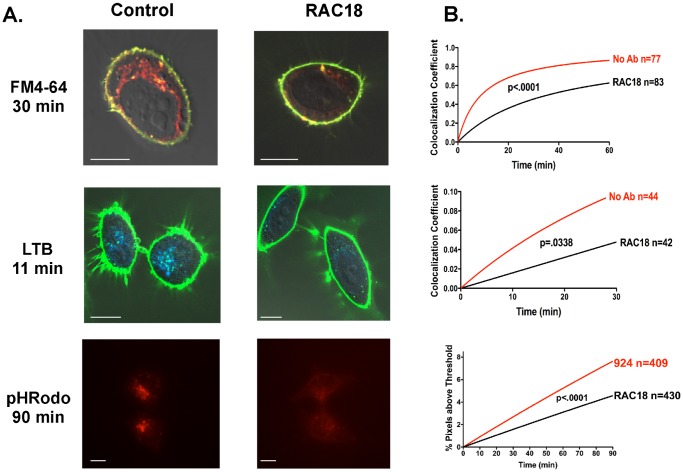
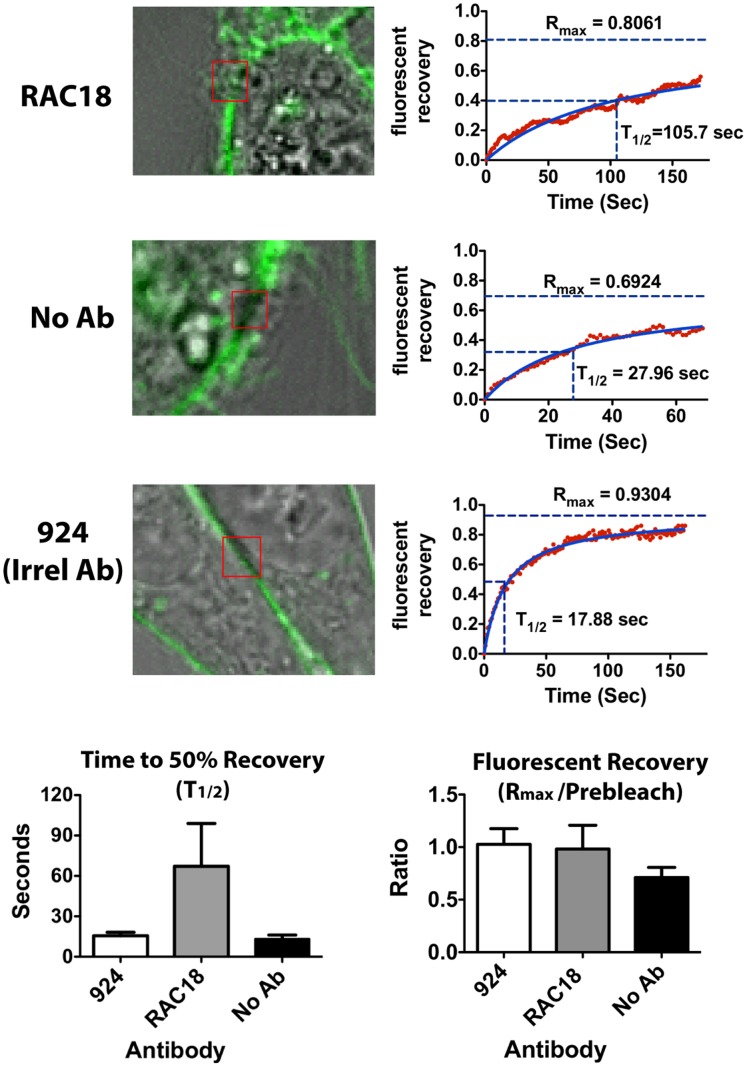
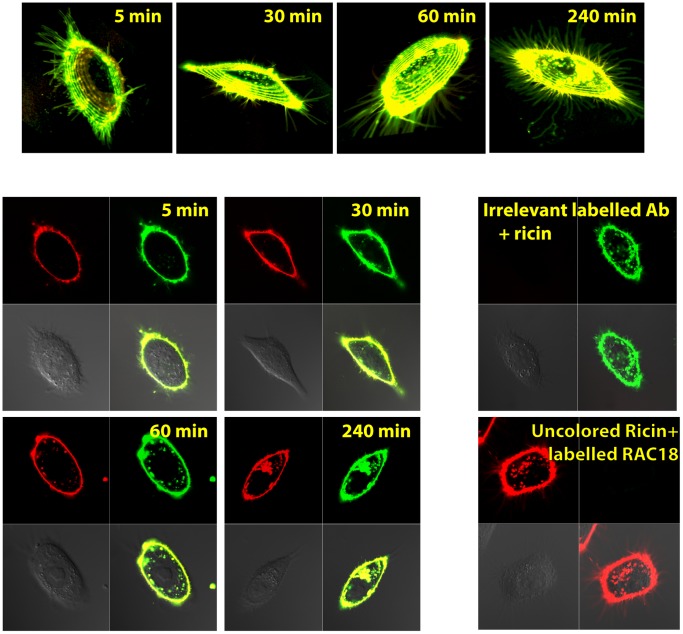
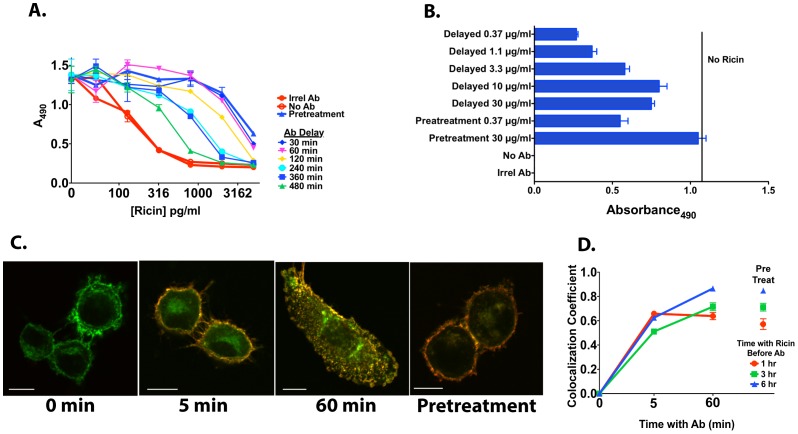
Methodology/principal findings: We use quantitative confocal imaging, neutralization assays, and other techniques to study how anti-A chain Abs function to protect cells. Without Ab, ricin enters cells and penetrates to the endoplasmic reticulum within 15 min. Within 45-60 min, ricin entering and being expelled from cells reaches equilibrium. These results are consistent with previous observations, and support the validity of our novel methodology. The addition of neutralizing Ab causes ricin accumulation at the cell surface, delays internalization, and postpones retrograde transport of ricin. Ab binds ricin for >6hr as they traffic together through the cell. Ab protects cells even when administered hours after exposure. CONCLUSIONS/KEY FINDINGS: We demonstrate the dynamic nature of the interaction between the host cell and toxin, and how Ab can alter the balance in favor of the cell. Ab blocks ricin's entry into cells, hinders its intracellular routing, and can protect even after ricin is present in the target organelle, providing evidence that the major site of neutralization is intracellular. These data add toxins to the list of pathogenic agents that can be neutralized intracellularly and explain the in vivo efficacy of delayed administration of anti-toxin Abs. The results encourage the use of post-exposure passive Ab therapy, and show the importance of the A chain as a target of Abs.


Conflict of interest statement

Competing Interests: The authors have read the journal's policy and have the following conflict. Jason M. Kirk is an employee of Zeiss Microsystems, the maker of some microscopy equipment used in this study. This does not alter the authors' adherence to all the PLOS ONE policies on sharing data and materials.

Figures

Figure 1
Figure 1. Demonstration of methods for quantifying confocal imaging data.
A. Cells were imaged as 1 µm vertical stacks at different times following the administration of ricin (always green in all figures). The cells were genetically modified to express DsRed in the endoplasmic reticulum. B. Each plane was viewed separately in this display. C. The third vertical image (upper right in panel B) was chosen for analysis. Two ROI’s were drawn: ROI 1. contains the intracellular ricin, ROI 2. defines the total amount of ricin associated with the cell. D. and E. are graphical and mathematical representations of the visual data.
Figure 2
Figure 2. Internalization of fluorescent ricin.
HeLa cells stably transfected with pDsRed-ER were plated on glass coverslips and incubated in tissue culture. One day later, half of the slides were washed with cold PBS, 1% BSA, 0.01% sodium azide and incubated in the same, on ice. The remaining slides were left under physiological conditions. Thirty min later, Alexa 488-conjugated ricin was added to each set of slides and the slides were incubated an additional 45 min under the same conditions as previously. Following this, cells were washed 3X with ice cold PBS/BSA/Azide. Cells were then incubated in either PBS or PBS/0.2M lactose for 5 min with orbital shaking. The solution was removed, fresh PBS or PBS/lactose added, and the process repeated three times. The cells were fixed in 2% paraformaldehyde. Cells were viewed with a 62X oil-immersion objective. Each panel shows a Z stack, each plane separated by 0.8 µm. The plane closest to the slide (bottom of the cell) is to the right. Ricin is green, ER red. There is no nuclear stain.
Figure 3
Figure 3. Internalization of ricin/mAb immune complexes.
Experimental conditions are as described in figure 2, except in this case the cells were first incubated with unlabeled ricin, washed, and then with Alexa 488-conjugated RAC18, either in the cold with azide, or at 370 in tissue culture medium.
Figure 4
Figure 4. Localization of ricin in ER.
In panel A five different views of the same image are shown, demonstrating the colocalization of ricin (green) and Ds-Red ER. The left panel shows a false color image of both markers, followed by two gray scale images showing the ricin and ER separately. The fluorescent intensity of each pixel is mapped in a 2-D dot-plot showing red on the vertical axis, and green on the horizontal axis. The right hand image maps the micrograph by quadrant of the pixel in the dot plot: pixels in quadrant one are green (ricin only), quadrant 2 are red (ER only), colocalized pixels are white (quadrant 3), pixels that fall below the threshold for both fluors are black. Panel B shows a false color confocal image, with a 10 µm×10 µm region marked. To the right are two vertical planes from that region, vertically separated by 0.7 µm. Colocalized pixels are yellow-orange. In panel C we show TEMs demonstrating HRP-ricin (red arrows) localized in the ER and Golgi.
Figure 5
Figure 5. Ricin enters cells and attains wide intracellular distribution within one hr.
A. and B. Two different live cells were repeatedly imaged with a wide field water immersion objective. Nuclei were stained with Hoechst dye (blue), ER and Golgi are stained with Bodipy-brefeldin A (red), and ricin (green) was added at 4 min. The white bar indicates 10 µm. The full time series are shown in videos S1 (A) and S2 (B). Time is indicated in min and sec. This degree of blebbing has been confirmed in >10 other time series micrographs. C. Percent of cell-associated ricin that has entered the cell was determined for 105 different cells in three separate time course experiments. Dots represent individual determinations, the curve was obtained using the model described in Methods. D. TEMs show ricin as electron-dense material and reveal ricin in the cell within 5 min and ricin coating vesicles and/or blebs by 30 min. Arrows indicate examples of cell-associated ricin accumulation. Images are representative of >100 images collected in two different experiments, each with up to 4 replicate samples. Figure 6 demonstrates that cell death does not occur until 24 hr.
Figure 6
Figure 6. Development of apoptosis and cell death following administration of ricin.
Live cells were incubated with ricin and at the indicated time points were stained with propidium iodide and Annexin V-Alexa 488, and analyzed by flow cytometry 15–30 min later. Propidium iodide is excluded from viable cells. Annexin-V binding is a measure of apoptosis. Thus cells can be considered healthy (lower left quadrant), dead by non-apoptotic mechanisms (ULQ), undergoing early apoptosis (LRQ) or dead by apoptosis (URQ). Significant increases in apoptotic or dying cells does not occur until 24 hr. These experiments have been repeated >3 times with similar results.
Figure 7
Figure 7. Ricin accumulates at the cell surface in the presence of neutralizing Ab.
Top. Live cells were incubated with labeled transferrin (red) and ricin (green) for 10 min in the presence of the indicated antibodies, or no antibody, and then fixed. Cells were imaged via confocal microscopy, and a central slice from a z stack is shown. In the absence of Ab (left), ricin and transferrin enter the cells by similar processes and colocalize. But in the presence of the nAb RAC18 (center), ricin is retained at the cell surface, while transferrin still enters. Non-neutralizing Ab RAC23 (right) has no effect on ricin internalization. Full z stacks of each of these photos are shown in videos S3, S4, S5, S6. These experiments have been replicated in three individual experiments, with >100 cells visualized. Bottom. The increase of cell surface ricin is confirmed, and quantified, by flow cytometry. Cells were incubated with the indicated Ab and ricin for 60 min either in the cold with sodium azide, or at 37° in tissue culture medium. The former studies passive binding at the cell surface, the latter also allows for internalization. 10,000 cells were analyzed. In either case RAC 18 results in approximately two-fold increase in cell-associated ricin.
Figure 8
Figure 8. Neutralizing Ab delays internalization of ricin.
A. Neutralization of ricin cytotoxicity by mAbs is confirmed using MTS assays. H9 cells were premixed with Ab at 10 µg/ml, and then ricin was added to the indicated concentration. MTS dye reduction was measured 48 hr later. This is representative of >5 Ab neutralization assays, error bars indicate SEM. B. HeLa-DsRed cells were incubated with labeled ricin (green) for the indicated time in the presence or absence of RAC18 mAb and images obtained by confocal microscopy. The white bar indicates 10 µm. C. Quantitative analyses of internalization and colocalization of ricin. Data are collected from confocal images, including those shown in panel B. At least three distinct experiments were performed and the number of individual data points collected is indicated in the table in panel D. Colors of curves conform to colored lettering in the table. D. Affinity of Abs, and data obtained from internalization curves shown in panel C. Affinity was determined by Biacore analyses of mAbs captured via Fc and tested against soluble ricin. N is the number of cells imaged to obtain the data for analysis, and the p value (by F test) compares the internalization curve of each Ab to that of no Ab.
Figure 9
Figure 9. Effect of nAb on intracellular localization of ricin.
Panel A shows original micrographs, B shows the curves extracted from such micrographs of live HeLa cells, imaged over time. The white bars on graphs indicate 10 µm. Indicated on the graph are the number of individual cells analyzed (in 3 or 4 distinct experiments) to obtain each curve, and the results of statistical comparisons of the curves. FM4-64 is a lipophilic dye, initially binding to the cell surface membrane, but then internalizing and become associated with intracellular lipid membrane structures. LTB is an acidophilic dye that initially accumulates in liposomes, but eventually also stains nuclei. For both FM4-64 and LTB, the proportion of ricin colocalizing with the dye is graphed. pHrodo was conjugated to ricin (and is shown in red). At acidic pH, the fluorescence of pHrodo is markedly enhanced. Thus for pHrodo, a threshold intensity was established at 100 (out of 256). The number of pixels exceeding that intensity were counted and plotted as percent positive within an ROI encompassing the entire cell.
Figure 10
Figure 10. Use of fluorescence recovery after photobleaching to study effect of Ab on mobility of cell membrane ricin.
Live cells were incubated with ricin-alexa 488. A region of the cell membrane was photobleached. Fluorescence in that region was measured prior to bleaching, and every second during the recovery phase. Top left: Photomicrographs of cells immediately following photobleach. The red square (2.94×3.15 µm) indicates the region that was bleached and measured. Top right: The fluorescent recovery is plotted versus time. Each red dot is an individual measurement. Videos S7, S8, and S9 show micrographs of the entire time series for each of the cells shown. The blue curves, Rmax, and T1/2 are derived from the same model used to calculate percent internalization and correlation coefficient. These curves were obtained from serial images of the cells shown to their left. Bottom. Statistical analyses of samples run in the presence of nAb, control Ab, or no Ab. Results are mean and SEM of six or seven independent analyses for each condition. Differences were not statistically significant.
Figure 11
Figure 11. Colocalization of ricin and mAb RAC18 following internalization into cells.
Live cells were incubated with labeled ricin (green) and RAC18 (red) and vertical stacks of confocal micrographs obtained at the indicated times. Colocalization of the two dyes appears yellow. At the top of the figure are the 3D representations of the merged fluorescent channels. At the bottom, a single plane from each stack shows the three channels imaged: red (Ab), green (ricin), and DIC, and then a merged image. Controls, which include labeled irrelevant Ab and unlabeled ricin with red-labeled RAC18, demonstrate that the colocalization is not an artifact of cross-channel readings. Panel C shows almost complete colocalization of Ab RAC18 (red) and ricin (green) 4 hr following ricin exposure. The micrographs are representative of >200 cells imaged in 5 distinct experiments.
Figure 12
Figure 12. Ab administration may be delayed and still retain protective activity.
A. H9 cells were cultured in triplicate in the presence of the indicated concentrations of ricin. RAC18 mAb (30 µg/ml) was either present prior to the ricin (pretreatment), or added after the indicated delay. 48hr later, an MTS dye reduction assay was performed. B. Same assay as in A, but with one concentration of ricin (1 ng/ml), and a fixed delay of 4 hr. Experiments demonstrating the protective effect of delayed ricin, similar to A and B, have been repeated >5 times. C. Confocal micrographs in which cells were incubated with labeled ricin (green) 3.6 µg/ml for 6 hr prior to the addition of the Ab (red) at 30 µg/ml. Times under micrographs indicate min after addition of Ab. Pretreatment had Ab present prior to ricin, and was incubated 6 hr. White bars in micrographs are 10 µm. D. Quantitative analysis of cells stained as described in panel C. ROIs were drawn to include all ricin associated with each cell. Ten cells were studied and the colocalization coefficient, the proportion of ricin bound to Ab, was determined for each (mean and SEM shown).
Figure 13
Figure 13. Measurements of cellular effects of Ab interactions with ricin are not influenced by source of Ab or type of cell tested.
The ability of Ab to protect cells from ricin’s lethal effect was measured by MTS dye reduction at 48 hr (H9 cells) or 72 hr (PHA blasts). Results are shown as percent inhibition of ricin’s cytotoxic effect, mean and SEM of triplicate samples. Left. Equine anti-ricin Ab was compared to murine RAC18 for neutralization of cytotoxicity on H9 cells. Ab was added prior to ricin or 4 hr afterwards. Right. Protection of H9 cells or primary PHA-stimulated lymphoblasts by serial dilutions of mRAC18 in the presence of ricin, 3.3 ng/ml.

References

    1. Leppla SH (2003) Domain structure of bacterial toxins. In: Burns DL, Barbieri JT, Iglewski BH, Rappuoli R, editors. Bacterial Protein Toxins. Washington DC: ASM Press. 132–133.
    1. Paul WE (2008) Fundamental Immunology. Philadelphia, PA: Lippincott Williams & Wilkens Wolters Kluwer. 1603 p. See page 1195.
    1. Murphy K, Travers P, Walport M (2008) Janeway's Immunobiology. New York, NY: Garland Science. 887 p. See page 413, figure 10.26.
    1. Parham P (2009) The Immune System. New York: Garland Publishing. See page 271, figure 9.28.
    1. Pappenheimer AM, Gill DM (1973) Diphtheria. Science 182: 353–358. - PubMed

Publication types

MeSH terms