

Phylogeny of bacterial and archaeal genomes using conserved genes: supertrees and supermatrices
- PMID: 23638103
- PMCID: PMC3636077
- DOI: 10.1371/journal.pone.0062510
Phylogeny of bacterial and archaeal genomes using conserved genes: supertrees and supermatrices
Abstract
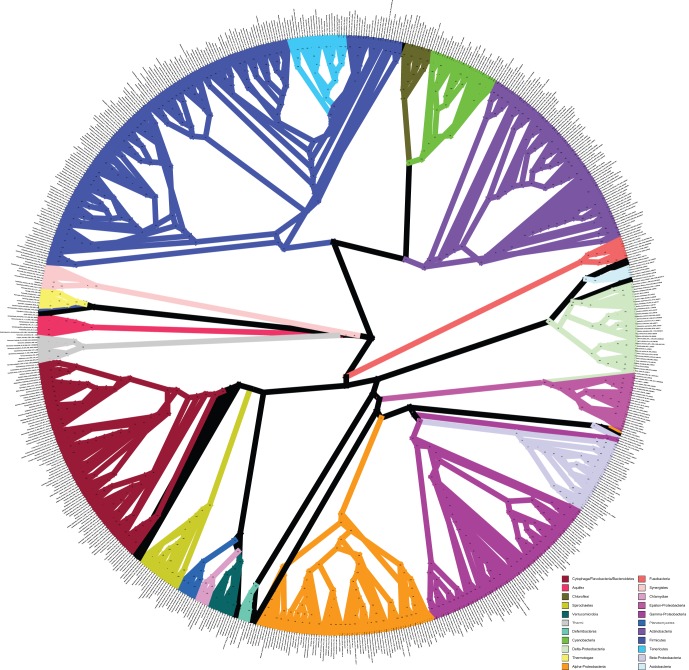
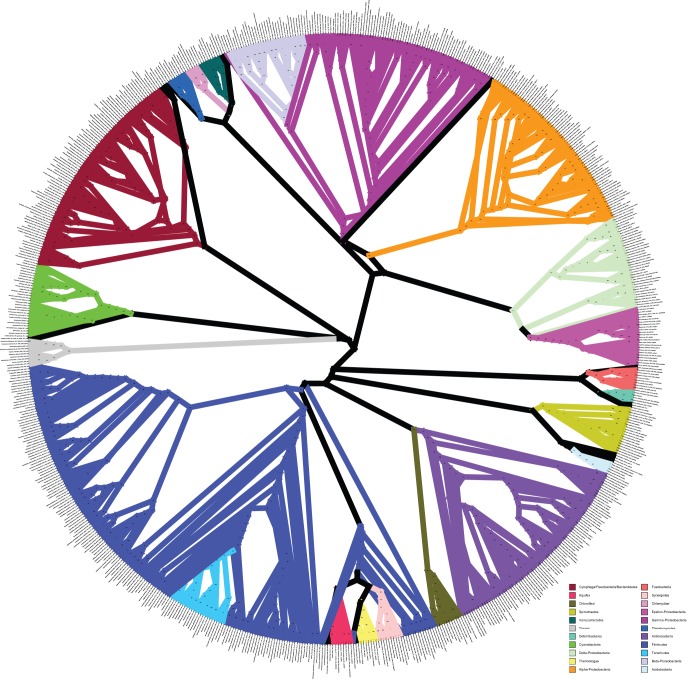
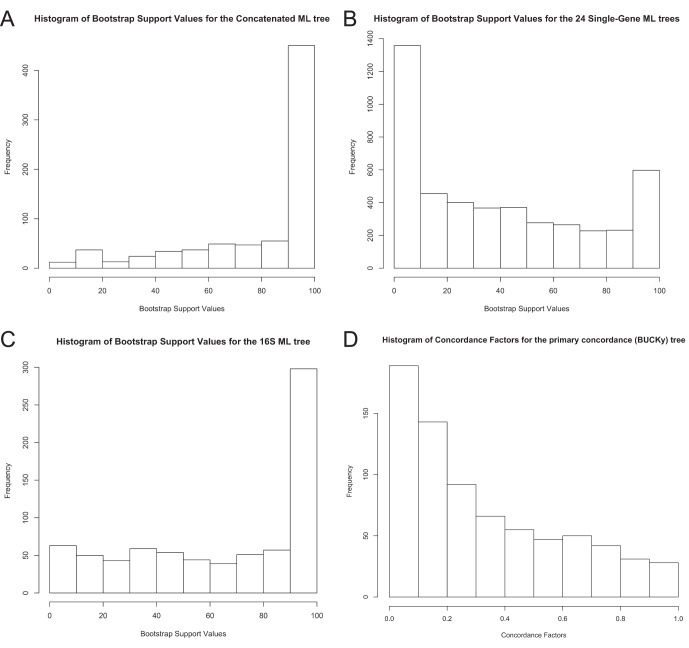
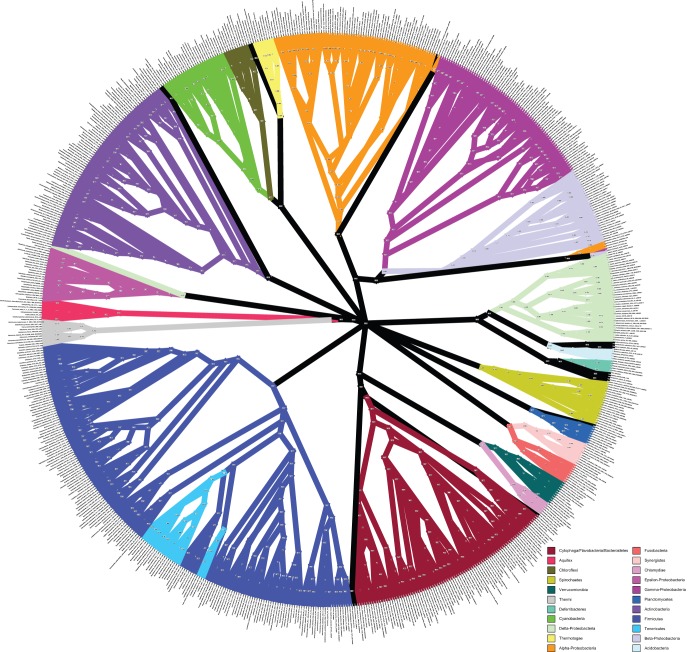
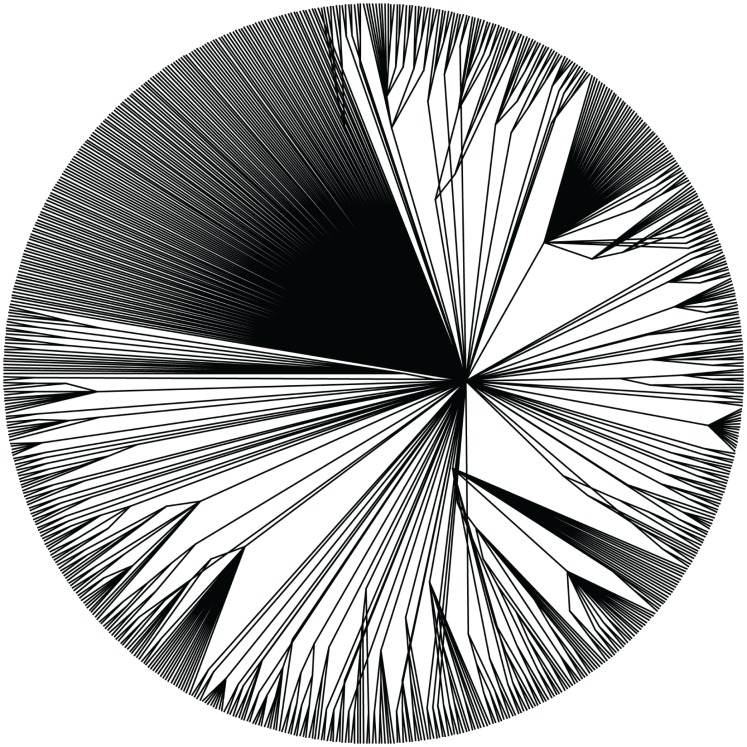
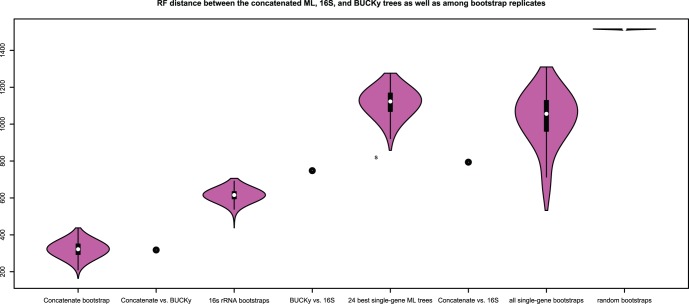
Over 3000 microbial (bacterial and archaeal) genomes have been made publically available to date, providing an unprecedented opportunity to examine evolutionary genomic trends and offering valuable reference data for a variety of other studies such as metagenomics. The utility of these genome sequences is greatly enhanced when we have an understanding of how they are phylogenetically related to each other. Therefore, we here describe our efforts to reconstruct the phylogeny of all available bacterial and archaeal genomes. We identified 24, single-copy, ubiquitous genes suitable for this phylogenetic analysis. We used two approaches to combine the data for the 24 genes. First, we concatenated alignments of all genes into a single alignment from which a Maximum Likelihood (ML) tree was inferred using RAxML. Second, we used a relatively new approach to combining gene data, Bayesian Concordance Analysis (BCA), as implemented in the BUCKy software, in which the results of 24 single-gene phylogenetic analyses are used to generate a "primary concordance" tree. A comparison of the concatenated ML tree and the primary concordance (BUCKy) tree reveals that the two approaches give similar results, relative to a phylogenetic tree inferred from the 16S rRNA gene. After comparing the results and the methods used, we conclude that the current best approach for generating a single phylogenetic tree, suitable for use as a reference phylogeny for comparative analyses, is to perform a maximum likelihood analysis of a concatenated alignment of conserved, single-copy genes.
Conflict of interest statement
Figures
Similar articles
-
Genome trees constructed using five different approaches suggest new major bacterial clades.BMC Evol Biol. 2001 Oct 20;1:8. doi: 10.1186/1471-2148-1-8. BMC Evol Biol. 2001. PMID: 11734060 Free PMC article.
-
Alternative methods for concatenation of core genes indicate a lack of resolution in deep nodes of the prokaryotic phylogeny.Mol Biol Evol. 2008 Jan;25(1):83-91. doi: 10.1093/molbev/msm229. Epub 2007 Oct 16. Mol Biol Evol. 2008. PMID: 17940208
-
Archaea-like genes for C1-transfer enzymes in Planctomycetes: phylogenetic implications of their unexpected presence in this phylum.J Mol Evol. 2004 Nov;59(5):571-86. doi: 10.1007/s00239-004-2643-6. J Mol Evol. 2004. PMID: 15693614
-
Prokaryotic genomes: the emerging paradigm of genome-based microbiology.Curr Opin Genet Dev. 1997 Dec;7(6):757-63. doi: 10.1016/s0959-437x(97)80037-8. Curr Opin Genet Dev. 1997. PMID: 9468784 Review.
-
Genomic and phylogenetic perspectives on the evolution of prokaryotes.Syst Biol. 2001 Aug;50(4):497-512. doi: 10.1080/10635150117729. Syst Biol. 2001. PMID: 12116649 Review.
Cited by
-
A cytoplasmic peptidoglycan amidase homologue controls mycobacterial cell wall synthesis.Elife. 2016 Jun 15;5:e14590. doi: 10.7554/eLife.14590. Elife. 2016. PMID: 27304077 Free PMC article.
-
Genomewide Identification of Essential Genes and Fitness Determinants of Streptococcus mutans UA159.mSphere. 2018 Feb 7;3(1):e00031-18. doi: 10.1128/mSphere.00031-18. eCollection 2018 Jan-Feb. mSphere. 2018. PMID: 29435491 Free PMC article.
-
The metabolic footprint of Clostridia and Erysipelotrichia reveals their role in depleting sugar alcohols in the cecum.Microbiome. 2021 Aug 19;9(1):174. doi: 10.1186/s40168-021-01123-9. Microbiome. 2021. PMID: 34412707 Free PMC article.
-
Genome-Based Microbial Taxonomy Coming of Age.Cold Spring Harb Perspect Biol. 2016 Jun 1;8(6):a018085. doi: 10.1101/cshperspect.a018085. Cold Spring Harb Perspect Biol. 2016. PMID: 26988968 Free PMC article. Review.
-
Phylogenetic determinants of toxin gene distribution in genomes of Brevibacillus laterosporus.Genomics. 2020 Jan;112(1):1042-1053. doi: 10.1016/j.ygeno.2019.06.020. Epub 2019 Jun 19. Genomics. 2020. PMID: 31226484 Free PMC article.
References
-
- Felsenstein J (2004) Inferring Phylogenies: Sinauer Associates: Sunderland, MA.
-
- Fitch WM, Margoliash E (1967) Construction of phylogenetic trees. Science 155: 279–284. - PubMed
-
- Hilario E, Gogarten JP (1993) Horizontal transfer of ATPase genes–the tree of life becomes a net of life. Biosystems 31: 111–119. - PubMed
Publication types
MeSH terms
Substances
LinkOut - more resources
Full Text Sources
Other Literature Sources
