. 2013 Apr 26;8(4):e62532.
doi: 10.1371/journal.pone.0062532. Print 2013.

MCT2 expression and lactate influx in anorexigenic and orexigenic neurons of the arcuate nucleus

Affiliations

MCT2 expression and lactate influx in anorexigenic and orexigenic neurons of the arcuate nucleus

Christian Cortes-Campos et al. PLoS One. .

Abstract

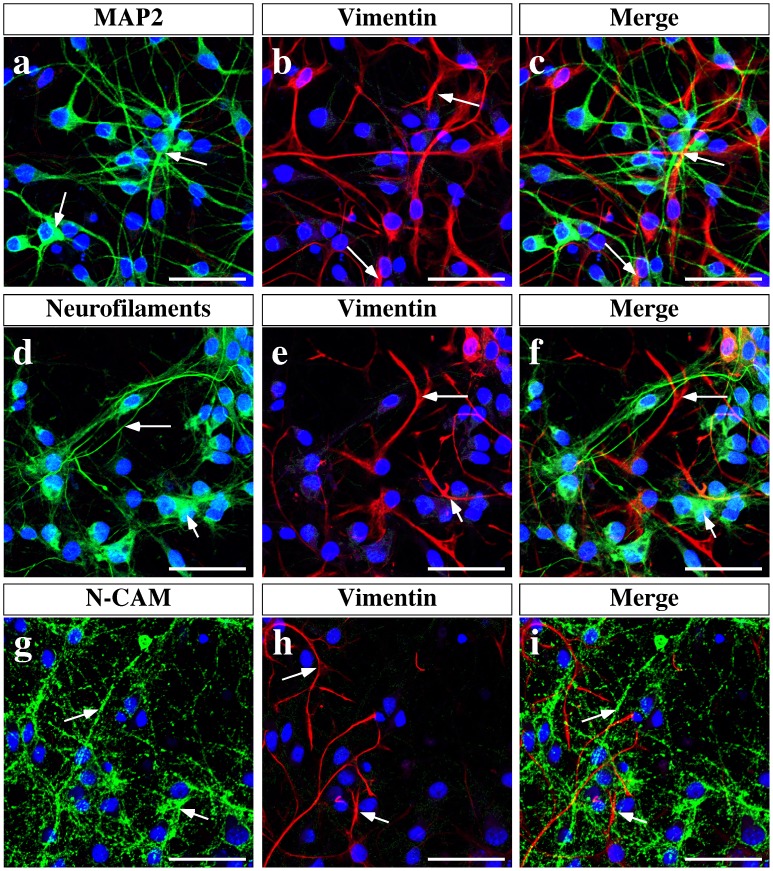
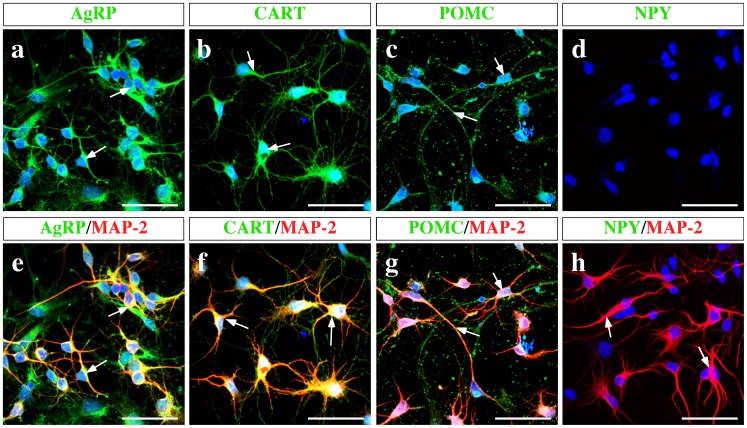
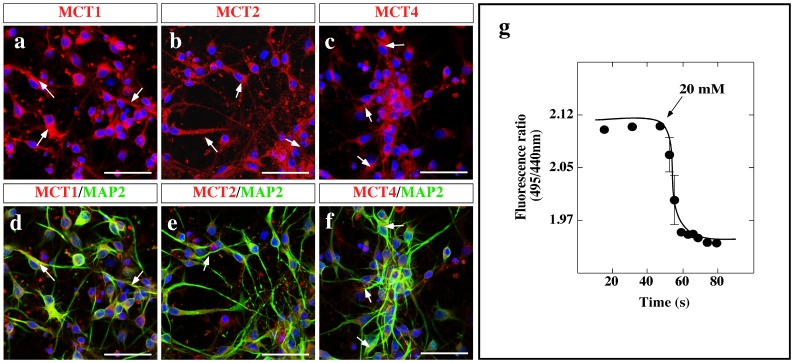
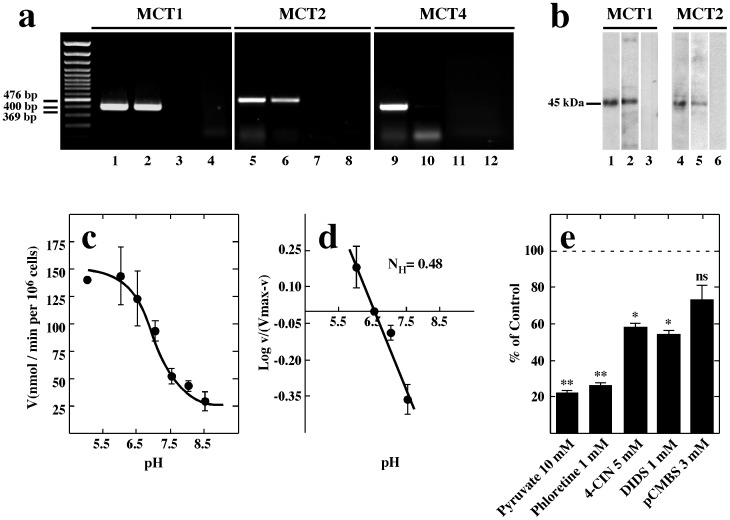
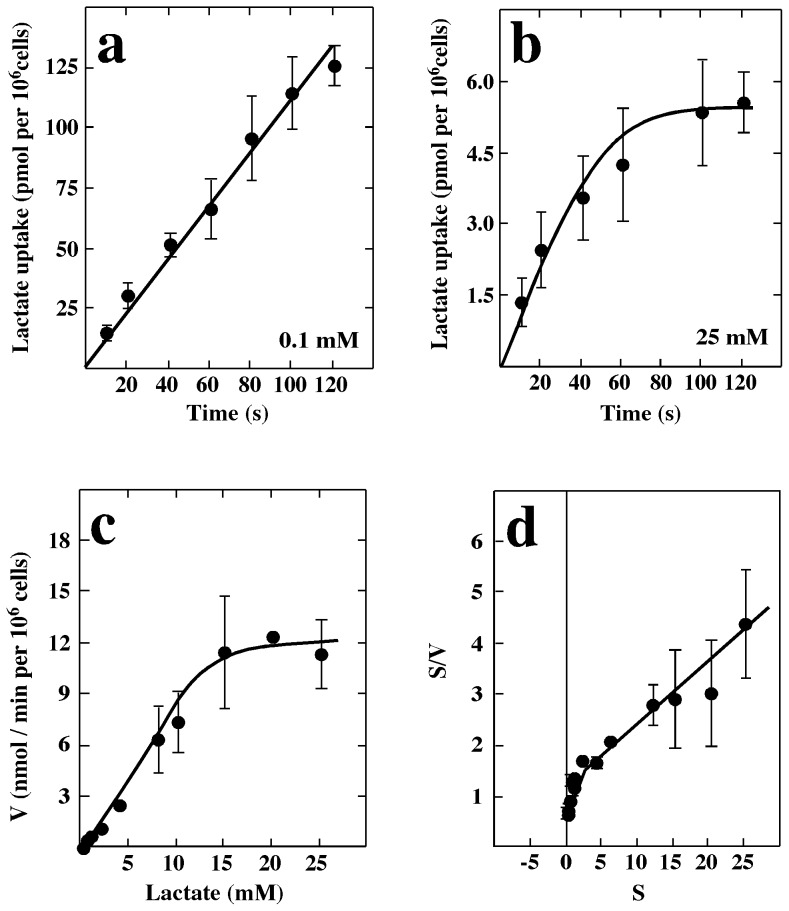
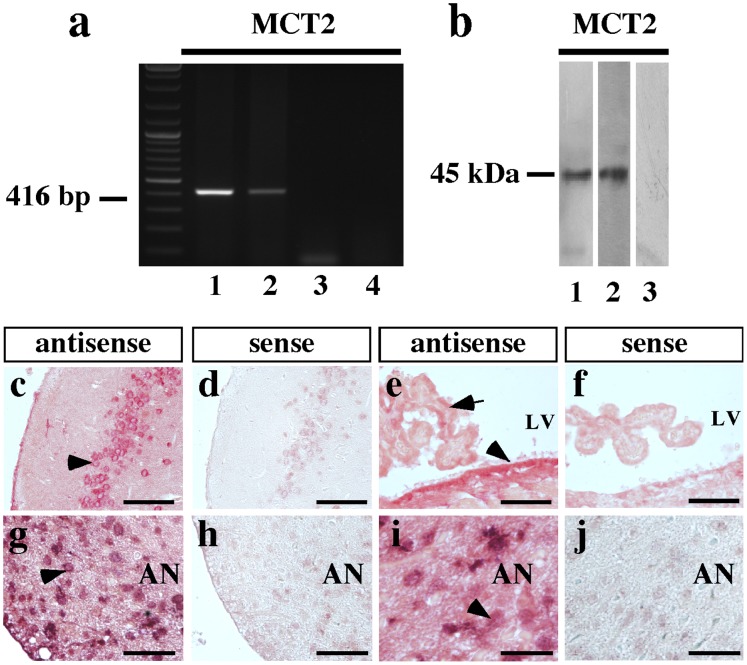
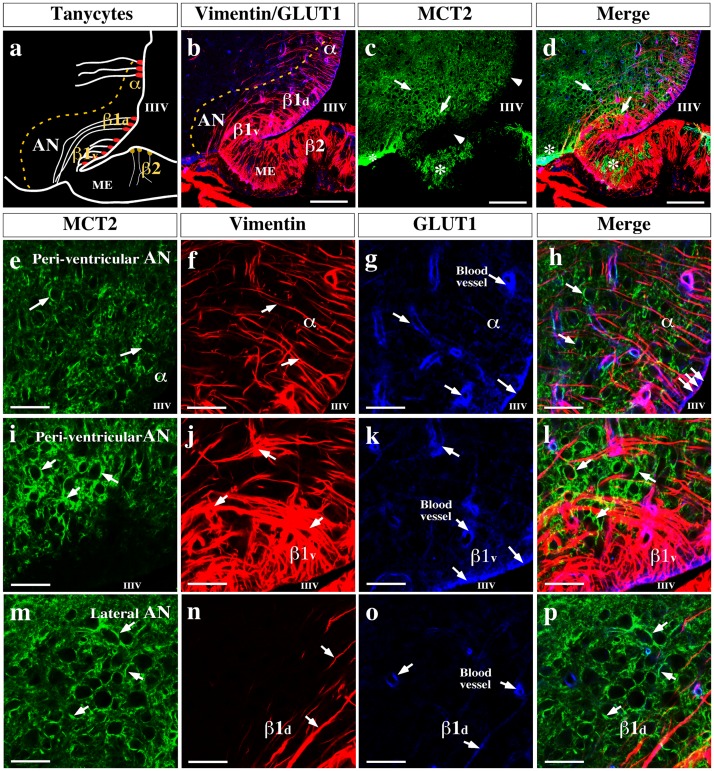
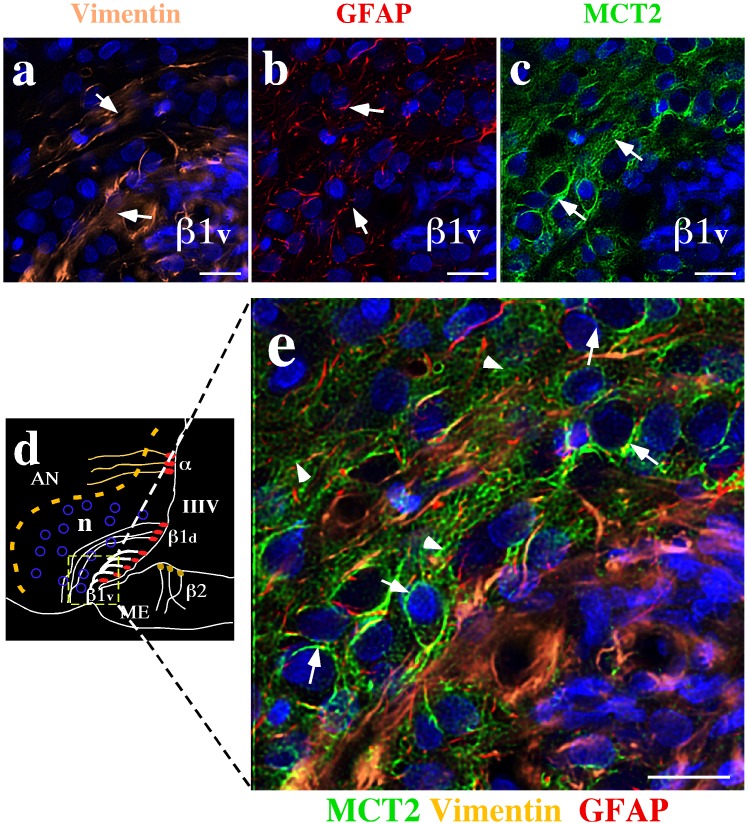
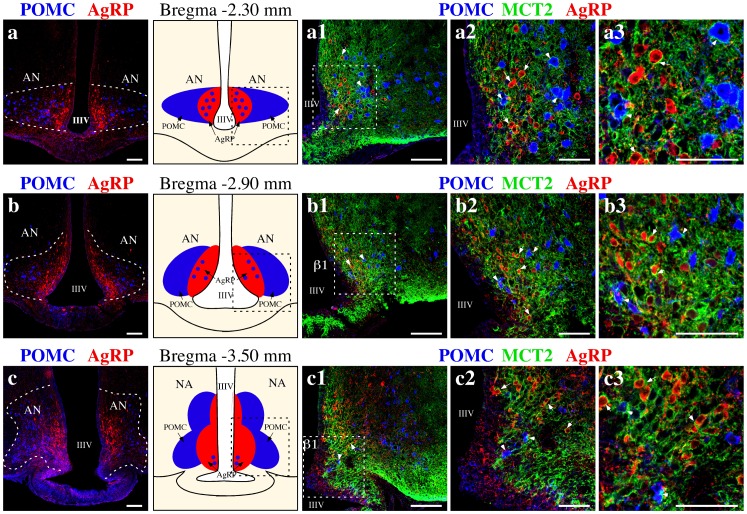
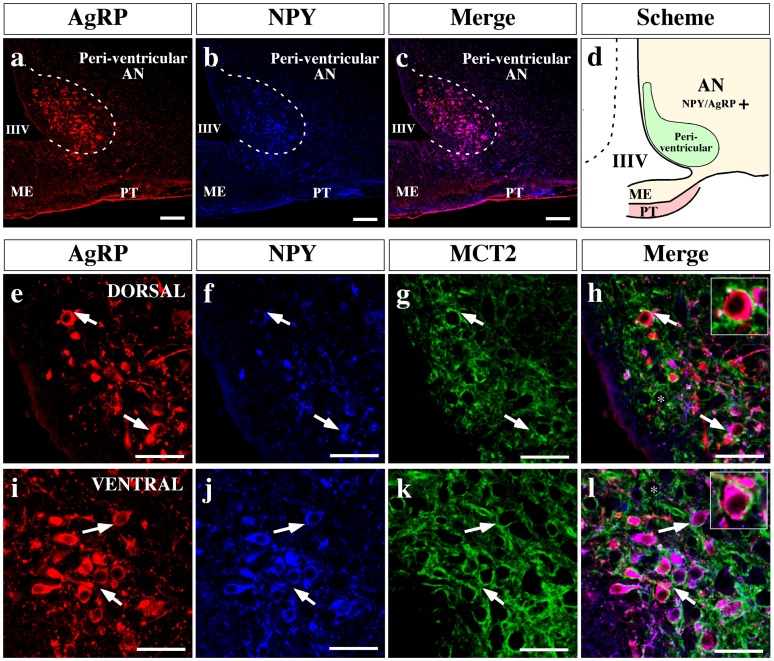
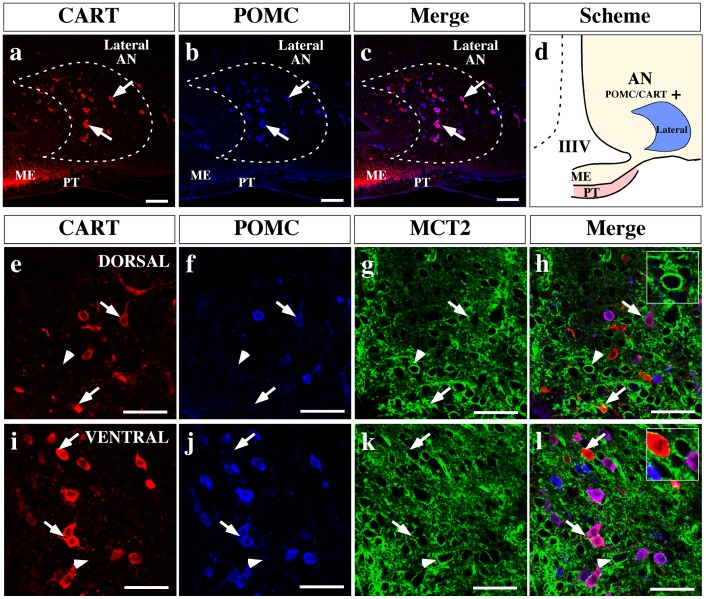
Hypothalamic neurons of the arcuate nucleus control food intake, releasing orexigenic and anorexigenic neuropeptides in response to changes in glucose concentration. Several studies have suggested that the glucosensing mechanism is governed by a metabolic interaction between neurons and glial cells via lactate flux through monocarboxylate transporters (MCTs). Hypothalamic glial cells (tanycytes) release lactate through MCT1 and MCT4; however, similar analyses in neuroendocrine neurons have yet to be undertaken. Using primary rat hypothalamic cell cultures and fluorimetric assays, lactate incorporation was detected. Furthermore, the expression and function of MCT2 was demonstrated in the hypothalamic neuronal cell line, GT1-7, using kinetic and inhibition assays. Moreover, MCT2 expression and localization in the Sprague Dawley rat hypothalamus was analyzed using RT-PCR, in situ hybridization and Western blot analyses. Confocal immunohistochemistry analyses revealed MCT2 localization in neuronal but not glial cells. Moreover, MCT2 was localized to ∼90% of orexigenic and ~60% of anorexigenic neurons as determined by immunolocalization analysis of AgRP and POMC with MCT2-positives neurons. Thus, MCT2 distribution coupled with lactate uptake by hypothalamic neurons suggests that hypothalamic neurons control food intake using lactate to reflect changes in glucose levels.


Conflict of interest statement

Competing Interests: The authors have declared that no competing interests exist.

Figures

Figure 1
Figure 1. Immunocharacterization of mixed primary cultures enriched in hypothalamic neurons.
Neurons obtained from rat hypothalamus at 19 days of gestation were cultured for 2 weeks. (a–i) Representative confocal images depicting MAP2 (a, green), Vimentin (b, e, and h, red), Neurofilaments (d, green), and N-CAM (g, green). Nuclei were stained with TOPRO-3 (blue). Triple labeling shows that the cultures are enriched in neurons (c, f and i). Scale bar: 80 µm.
Figure 2
Figure 2. Orexigenic and anorexigenic neuropeptides are expressed in hypothalamic primary cell culture.
(a–d) Representative confocal images of AgRP (a, green), CART (b, green), POMC (c, green), and NPY (d, green) cells. The neuronal identity was confirmed using a MAP2 antibody (e–h). Scale bar: 80 µm.
Figure 3
Figure 3. MCT analysis in hypothalamic primary cell culture.
(a–f) Representative confocal images of MCT1 (a, red), MCT2 (b, red), and MCT4 (c, red) neurons. Co-distribution of MCT1, MCT2, and MCT4 with MAP2 (d–f, green). Nuclei were stained with TOPRO-3 (blue). Scale bar: 80 µm. (g) Fluorescence ratio of neurons as a function of time. The cells were incubated for 10 min with dicyclohexylcarbodiimide (DCCD; 50 mM) to inhibit the V-type H+-ATPase in these cells. At the indicated times, 20 mM L-lactate was added at 18°C.
Figure 4
Figure 4. MCTs are expressed in the GT1-7 cell line.
(a) RT-PCR and (b) immunoblot analyses of MCT1, MCT2 and MCT4 mRNA and protein expression, respectively. RNA isolated from mouse hypothalamus (lanes 1, 5 and 9) and GT1-7 cultures (lanes 2, 6 and 10). RT(−) of GT1-7 culture (lanes 3, 7 and 11). Total protein extracted from mouse hypothalamus (lanes 1 and 4) and GT1-7 (lanes 2–3 and 5–6). (c) Dependence of lactate uptake on pH at 0.1 mM L-lactate and 20°C. (d) Hill plot to analyze the dependence of lactate uptake on pH. (e) Analysis of lactate transport in the presence of various inhibitors co-incubated for 1 min with 0.1 mM lactate at 20°C and pH 7.0.
Figure 5
Figure 5. Functional characterization of MCT in the GT1-7 cell line.
(a) Time course of 0.1 mM and (b) 25 mM L-lactate at 4°C and pH 7.0. (c) Kinetic parameters of L-lactate transport in GT1-7 cells after 30 s at 4°C, and pH 7.0. (d) Hanes–Woolf plot of MCT1: (Km, 2.2±0.4 mM; Vmax, 3 nmol/min per 106 cells) and MCT2: (Km, 0.3±0.1 mM; Vmax, 1 nmol/min per 106 cells). Results represent the mean ± SD of three independent experiments. **p<0.001, one tailed t-test.
Figure 6
Figure 6. MCT2 expression in adult rat hypothalamus.
(a) RT-PCR analysis of RNA isolated from rat cerebral cortex (lane 1) and rat hypothalamus (lanes 2–3). RT(−) (lane 3) and water in the PCR reaction (lane 4). (b) Immunoblot analysis of total protein extracted from rat cerebral cortex (lane 1) and rat hypothalamus (lane 2). Negative control was performed with primary antibodies pre-adsorbed with inductor peptide (lane 3). (c–h) Neuronal MCT2 mRNA detection by in situ hybridization. Frontal section of rat brain probed with a MCT2 antisense riboprobe. A representative panoramic image showing high hybridization signal in basal hypothalamus (c), in neurons of entorrinal cortex (d). Ependymal cells of lateral ventricle and some choroidal cells present positive hybridization with antisense MCT2 riboprobe (e). In the hypothalamus, a high hybridization signal was observed in neurons of peri-ventricular (g) and distal (i) arcuate nucleus. Negative reaction was obtained using sense riboprobes in control areas (insets in c–g). AN: arcuate nucleus, LV: lateral ventricle. Scale bar: (c–f) 50 µm; (g–j) 20 µm.
Figure 7
Figure 7. MCT2 is localized in the arcuate nucleus.
(a) Schematic representation of the hypothalamic area shown in b–d. (b) Rat frontal brain section using anti-vimentin (red) and anti-GLUT1 (blue) antibodies, markers of glial cells. (c) MCT2 localization. (d) Rat frontal brain section using anti-vimentin (red), anti-GLUT1 (blue), and anti-MCT2 (green) antibodies. (e–h) MCT2 was observed in cellular membranes (e) of dorsal peri-ventricular arcuate nucleus areas; this area was negative for vimentin (f, h) and GLUT1 (g, h). GLUT1 and vimentin are co-distributed in the apical region of α-tanycytes (h, triple-arrows). (i–l) In the ventral peri-ventricular area, which contains β1-tanycytes, MCT2 was expressed in cellular membranes; this area was negative for vimentin (j) and GLUT1 (k). GLUT1 and vimentin are co-distributed in apical region of β1-tanycytes (arrows). (m–p) MCT2 was observed in the cellular membranes of β1-tanycyte processes in the ventral lateral area of the arcuate nucleus, which was negative for vimentin (n, p) and GLUT1(o, p). AN: arcuate nucleus, III–V: third ventricle, ME: median eminence. Scale bar: (b and e) 150 µm; (c–d and f–u) 50 µm.
Figure 8
Figure 8. MCT2 is expressed in arcuate nucleus neurons.
(a–c) Low magnification analysis of the basal hypothalamic area using anti-vimentin (a, orange), anti-GFAP (b, red) anti-MCT2 (c, green) antibodies. TOPRO-3 was used as nuclear stain (blue). (d) Schematic representation of the hypothalamic area shown in e. (e) High magnification analysis using quadruple labeling. MCT2 labeling was negative in β1v-tanycytes (positive for vimentin) or β1d-tanycytes (positive for GFAP) or astrocytes (positive for GFAP). The MCT2 reaction was concentrated in membranes of arcuate neurons (e, arrows), and neuronal processes (e, head arrows). AN: arcuate nucleus, III–V: third ventricle, ME: median eminence, n: neurons. Scale bar: 10 µm.
Figure 9
Figure 9. MCT2 is localized in both AgRP and POMC neurons of the arcuate nucleus.
(a–c) Anteroposterior reconstruction of the basal hypothalamus. MCT2 (green), AgRP (red), POMC (blue). In the anterior region of AN (bregma −2.30 mm), MCT2 is localized in POMC neurons (a1–a3, arrowheads) and AgRP neurons (a1–a3, arrows). In the medial region of the AN (bregma −2.90 mm), MCT2 is localized mainly in AgRP neurons (b1–b3, arrows) and some POMC neurons, which are next to III–V (b1–b3, arrowheads). In the posterior region of the AN, MCT2 is segregated to AgRP neurons (arrows c1–c3) and only a few POMC neurons (c1–c3, arrowheads). AN: arcuate nucleus, IIIV: third ventricle. Scale bars: (a–c and a1–c1) 150 µm; (a2, a3, b2, b3, c2 and c3) 50 µm.
Figure 10
Figure 10. MCT2 is localized in orexigenic neurons of the arcuate nucleus.
(a–c) Low magnification images of the ventro-medial hypothalamus, analyzed by immunohistochemistry using anti-AgRP (red) and anti-NPY (blue) antibodies. Ventricular arcuate nucleus neurons co-express AgRP and NPY (c). (d) Scheme summarizing the localization of the orexigenic neuropeptides in the AN. (e–l) High magnification images showing the dorsal (e–h) and ventral (i–l) region of the ventricular AN. An intense MCT2 immunoreaction was detected in orexigenic neuronal bodies in both areas (insets h and l). AN: arcuate nucleus, IIIV: third ventricle, ME: median eminence, PT: pars tuberalis. Scale bars: (a–c) 150 µm; (e–l) 50 µm.
Figure 11
Figure 11. MCT2 is localized in anorexigenic neurons of AN.
(a–c) Low magnification images of ventro-medial hypothalamus, analyzed by immunohistochemistry using anti-CART (red) and anti-POMC (blue) antibodies. Lateral arcuate nucleus neurons show a segregated distribution of both neuropeptides (c). (d) Scheme summarizing the localization of the anorexigenic neuropeptides in the AN. (e–l) High magnification images showing a dorsal (e–h) and ventral (i–l) region of ventricular AN. MCT2 immunoreaction was detected in some neuronal bodies that express one or both anorexigenic neuropeptides, in both areas (h and l). AN: arcuate nucleus, IIIV: third ventricle, ME: median eminence, PT: pars tuberalis. Scale bars: (a–c) 150 µm; (e–l) 50 µm.

Similar articles

Cited by

References

    1. Oomura Y, Yoshimatsu H (1984) Neural network of glucose monitoring system. J Auton Nerv Syst 10: 359–372. - PubMed
    1. Yang XJ, Kow LM, Funabashi T, Mobbs CV (1999) Hypothalamic glucose sensor: similarities to and differences from pancreatic beta-cell mechanisms. Diabetes 48: 1763–1772. - PubMed
    1. Blouet C, Schwartz GJ (2010) Hypothalamic nutrient sensing in the control of energy homeostasis. Behav Brain Res 209: 1–12. - PubMed
    1. Schwartz MW, Woods SC, Porte D Jr, Seeley RJ, Baskin DG (2000) Central nervous system control of food intake. Nature 404: 661–671. - PubMed
    1. Levin BE, Routh VH, Kang L, Sanders NM, Dunn-Meynell AA (2004) Neuronal glucosensing: what do we know after 50 years? Diabetes 53: 2521–2528. - PubMed

Publication types

LinkOut - more resources