. 2013 Apr 26;8(4):e62622.
doi: 10.1371/journal.pone.0062622. Print 2013.

Inefficient TLR4/MD-2 heterotetramerization by monophosphoryl lipid A

Affiliations

Inefficient TLR4/MD-2 heterotetramerization by monophosphoryl lipid A

Carolyn R Casella et al. PLoS One. .

Abstract

Synthetic forms of E. coli monophosphoryl lipid A (sMLA) weakly activate the MyD88 (myeloid differentiation primary response protein) branch of the bifurcated TLR4 (Toll-like receptor 4) signaling pathway, in contrast to diphosphoryl lipid A (sDLA), which is a strong activator of both branches of TLR4. sMLA's weak MyD88 signaling activity is apparent downstream of TLR4/MyD88 signaling as we show that sMLA, unlike sDLA, is unable to efficiently recruit the TNF receptor-associated factor 6 (TRAF6) to the Interleukin-1 receptor-associated kinase 1 (IRAK1). This reduced recruitment of TRAF6 explains MLA's lower MAPK (Mitogen Activated Protein Kinase) and NF-κB activity. As further tests of sMLA's ability to activate TLR4/Myeloid differentiation factor 2 (MD-2), we used the antibody MTS510 as an indicator for TLR4/MD-2 heterotetramer formation. Staining patterns with this antibody indicated that sMLA does not effectively drive heterotetramerization of TLR4/MD-2 when compared to sDLA. However, a F126A mutant of MD-2, which allows lipid A binding but interferes with TLR4/MD-2 heterotetramerization, revealed that while sMLA is unable to efficiently form TLR4/MD-2 heterotetramers, it still needs heterotetramer formation for the full extent of signaling it is able to achieve. Monophosphoryl lipid A's weak ability to form TLR4/MD-2 heterotetramers was not restricted to synthetic E. coli type because cells exposed to a biological preparation of S. minnesota monophosphoryl lipid A (MPLA) also showed reduced TLR4/MD-2 heterotetramer formation. The low potency with which sMLA and MPLA drive heterotetramerization of TLR4/MD-2 contributes to their weak MyD88 signaling activities.


Conflict of interest statement

Competing Interests: The authors have declared that no competing interests exist.

Figures

Figure 1
Figure 1. Reduced MyD88-associated signaling by sMLA.
Mouse BMDC were treated with 100 ng/ml sMLA or sDLA for the indicated times, lysed and either immunoblots (A,C) or immunoprecipitation (B) were performed on the lysates. A) Immunoblots were probed for IRAK1 and β-actin. A representative gel is depicted with a graph that shows the mean +/− SEM from 5 experiments in which IRAK1 levels were normalized to β-actin levels and vehicle control (VC, measured at 15 min.). B) Lysates were immunoprecipitated with IRAK1 antibodies and immunoblotted with antibodies for TRAF6 and IRAK1. The graph shows mean +/− SEM from 8 experiments with at least 5 data points per time point. TRAF6 levels were normalized based on IRAK1 levels and VC (5 min. time point). C) Left, Immunoblots were probed for phosphoERK 1/2 (Thr202/Tyr204), stripped and re-probed for ERK total, then β-actin. Shown are the mean +/− SEM from 5 experiments with levels of pERK1/2 normalized to ERK total and VC (15 min. time point). Right, immunoblots were probed for IκBα stripped and probed for β-actin. Shown are the mean +/− SEM from 4 experiments with levels of IκBα normalized to β-actin and VC (5 min. time point). Two way ANOVAs with Sidak’s multiple comparisons were performed for A and C and two tailed paired T test for B. Asterisks indicate a significant differences between sMLA and sDLA at the indicated time points with * p<0.05, ** p<0.01 and, **** p<0.001, respectively.
Figure 2
Figure 2. Reduced formation of TLR4/MD-2 heterotetramers by sMLA.
A, B) BMDC were incubated with sMLA or sDLA at the indicated concentrations for 15 min. at 370 C. Cells were then stained with MTS510 or UT41 mAb or the appropriate isotype controls along with anti-CD11c. Histograms shown are gated through live CD11c+ cells. The histogram overlay is of agonist activated cells stained with MTS510 or UT41 mAb (gray filled), or isotype mAb (light line) and vehicle control treated cells stained with MTS510 or UT41 mAb (dark line). B) The geometric mean signals from all antibody stains was used in the equation (((VC MTS510-VC isotype)-(agonist MTS510-agonist isotype))/(VC MTS510-VC isotype)) X 100 to calculate staining intensities for each dose indicated. The same formula was used for UT41 mAb stains. The graphs show the mean +/− SEM from 7 experiments (1–10 ng/ml) or 8 experiments (100–1,000 ng/ml) for MTS510 mAb staining and 6 experiments for UT41 mAb staining. C) Immunoblots of BMDC activated with 1–1000 ng/ml of sMLA or sDLA for 20 min. and probed for phospho-IKKα(Ser176)/IKKβ(Ser177). The blot shown is representative of one of three similar experiments. D) Using the same cell cultures as A and B, IL-6 ELISA was performed and the mean of 5 experiments with triplicate samples +/− SEM is shown. The asterisk represents, for B a significant difference from vehicle control, and for D a significant difference between sDLA and sMLA, with *p<0.05, **p<0.01, ***p<0.001, and **** p<0.0001, respectively. A two-tailed paired T test was performed for the MTS510 measurements, and a two-way ANOVA with Sidak’s multiple comparisons was performed for the rest.
Figure 3
Figure 3. sMLA is further reduced in signaling if heterotetramerization of TLR4/MD-2 is prevented.
HEK 293 cells were engineered to express either mouse MD-2 and CD14 or mouse F126A MD-2 and CD14 and transfected with a mouse TLR4 construct and a reporter plasmid that expresses SEAP upon activation of NF-κB. A) Fold-increase in SEAP activity was calculated by dividing the SEAP activity of the agonist by the SEAP activity from the vehicle control for that cell line. The graph shows the mean +/− SEM from 3 experiments in which the TLR4 transfection efficiencies of WT and F126A MD-2 cells were within 10% of each other. B) Histograms and dot blots are of live cells. Two wild type clones (WT) and two F126A MD-2 (MU) clones were stained for the presence of CD14 top panel. Bottom panel staining: HEK293 cells transfected with mouse TLR4 and thy 1.1 expressing construct or TLR4 and a MD-2/thy1.1 expressing construct stained with MTS510. Also shown are the WT1, WT2, MU1, and MU2 clones stained with MTS510 as an indication of surface expression of TLR4 and MD-2. C-E) EC50 measurement. The maximum SEAP values per clone was used to calculate 100% of maximum and a nonlinear curve fit, variable slope with 4 parameters was used to calculate the EC50 of each curve. C) Representative curve fits from one experiment for WT1 and MU2 clones showing the mean +/− SEM. A comparison of fits on Log EC50 using the Extra sum-of squares F test, was performed on the curves. D) Mean values +/− SEM of the log EC50 of three experiments with two clones for WT and MU. E) The difference in the log EC50 for sMLA and sDLA for WT and MU MD-2 as indicated at the bottom of the graph. The experiment in C–E was performed 3 times with triplicate samples for each dose of agonist. Asterisks represent the significant difference between agonist and vehicle control for A, and a significant difference between WT and MU for D and E, with *p<0.05, **p<0.01, ***p<0.001, ****p<0.0001, respectively. A paired two tailed T test was performed for Log EC50 difference, and a two-way ANOVA with Tukey’s multiple comparison test or Sidak’s multiple comparisons were performed A and D, respectively.
Figure 4
Figure 4. Dependence on MyD88 for NF-κB stimulation in HEK293 cells.
HEK 293 cells expressing mouse WT MD-2/WT CD14 or F126A MD-2/WT CD14 cells were transfected with a mouse TLR4 expression plasmid, a NF-κB reporter plasmid expressing SEAP and either LucGL3 control shRNA or MyD88 shRNA. A) Transfected cells were stimulated overnight with vehicle control (VC), 1 ng/ml TNFα, 100 ng/ml sMLA or sDLA for WT and 1 µg/ml for MU cells and SEAP levels were measured. Shown are the means +/− SD from 4 experiments, each with triplicate samples. Measurements of SEAP activity were normalized for TLR4 expression between control and MyD88 shRNA samples. TLR4 expression levels were within 15% of each other. B) Representation of data from (A) where 100% represents SEAP activity after treatment with control shRNA and sMLA or sDLA, respectively. C) WT MD-2/CD14 expressing HEK 293 cells were transfected with NF-κB reporter plasmid and pUNOmTLR4HA3x or pUnoMSC with LucGL3 shRNA. Cells were activated with VC for overnight and SEAP activity was measured. The graph shows the mean +/− SD from 2 experiments with triplicate samples. D) Mean +/− SD of Real Time PCR of MyD88 mRNA levels compared to levels in control shRNA transfected cells, corrected for transfection efficiency of shRNA which was on average 46.5+/−3.3 (SD) and 66.8+/−5 (SD) for WT and MU, respectively. A two-way ANOVA with Sidak’s multiple comparisons was performed for A, B, C; ****p<0.0001 and a two-tailed unpaired t test was performed for C, p = 0.0007.
Figure 5
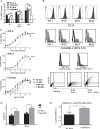
Figure 5. Non-synthetic MPLA also fails to drive heterotetramer formation.
A) BMDCs were activated with the indicated concentrations of MPLA or Lipid A for 15 min. at 37o C. The cells were stained with anti-CD11c, and MTS510, UT41, or appropriate isotype controls. Live CD11c+ cells were gated and representative histograms are shown. The histogram overlay is of agonist activated cells stained with MTS510 or UT41 mAb (gray filled), or isotype mAb (light line) and vehicle control treated cells stained with MTS510 or UT41 mAb (dark line). B) Mean +/− SD of staining in A from 3 independent experiments as explained in Figure 2, significance represents the difference of sMLA or sDLA from the vehicle control sample. C) Mean +/− SD of IL6 measurements in 2 of the 3 experiments performed in B) with triplicate samples. D-G) EC50 measurement. HEK293 cells expressing either WT or F126A MD-2 and CD14, were transfected with TLR4 and a reporter plasmid that expresses SEAP upon NF-κB activation. Three independent experiments with triplicate samples were performed using two WT and MU cell clones. Maximal values were plotted as 100% to create a dose response curve. GraphPad Prism’s nonlinear curve fit, variable slope with 4 parameters was used to determine EC50’s. C) An example from one experiment of dose response curves used to measure EC50 is shown with mean +/− SD. A comparison of fits on Log EC50 using the Extra sum-of squares F test, was performed on the curves. D-F) The mean of 3 experiments with triplicate samples +/− SEM is depicted. G) The average +/− SEM of % max reached in EC50 measurements for MPLA in above experiments and sMLA in experiments from Fig. 2. A two way ANOVA with Sidak’a multiple comparisons (B, E), a paired two tailed T test (F), and an unpaired two tailed T test (G) was used to test for statistical significance. Asterisks represent, for B a statistical differences between agonist and vehicle control, for E-G statistical differences between WT and MU, *p<0.05, **p<0.01, ***p<0.001, ****p<0.0001, respectively.

Similar articles

Cited by

References

    1. Garcon N, Chomez P, Van MM (2007) GlaxoSmithKline Adjuvant Systems in vaccines: concepts, achievements and perspectives 1. Expert Rev Vaccines 6: 723–739. - PubMed
    1. Casella CR, Mitchell TC (2008) Putting endotoxin to work for us: monophosphoryl lipid A as a safe and effective vaccine adjuvant. Cell Mol Life Sci 65: 3231–3240 10.1007/s00018-008-8228-6 [doi]. - DOI - PMC - PubMed
    1. Ribi E, Parker R, Strain SM, Mizuno Y, Nowotny A, et al. (1979) Peptides as requirement for immuno therapy of the guinea-pig line-10 tumor with endotoxins. Cancer Immunol Immunother 7: 43–58.
    1. Mata-Haro V, Cekic C, Martin M, Chilton PM, Casella CR, et al. (2007) The vaccine adjuvant monophosphoryl lipid A as a TRIF-biased agonist of TLR4. Science 316: 1628–1632 316/5831/1628 [pii]; 10.1126/science.1138963 [doi]. - DOI - PubMed
    1. Thompson BS, Chilton PM, Ward JR, Evans JT, Mitchell TC (2005) The low-toxicity versions of LPS, MPL adjuvant and RC529, are efficient adjuvants for CD4+ T cells. J Leukoc Biol 78: 1273–1280 jlb.0305172 [pii]; 10.1189/jlb.0305172 [doi]. - DOI - PubMed

Publication types

MeSH terms