

Image quality assessment of automatic three-segment MR attenuation correction vs. CT attenuation correction
- PMID: 23638340
- PMCID: PMC3627525
Image quality assessment of automatic three-segment MR attenuation correction vs. CT attenuation correction
Abstract
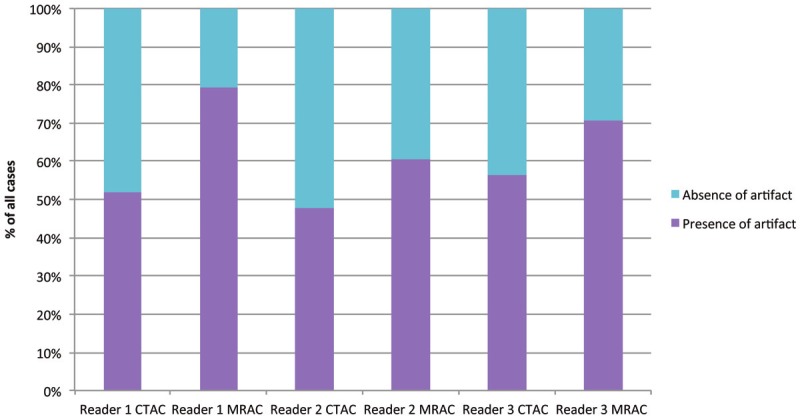
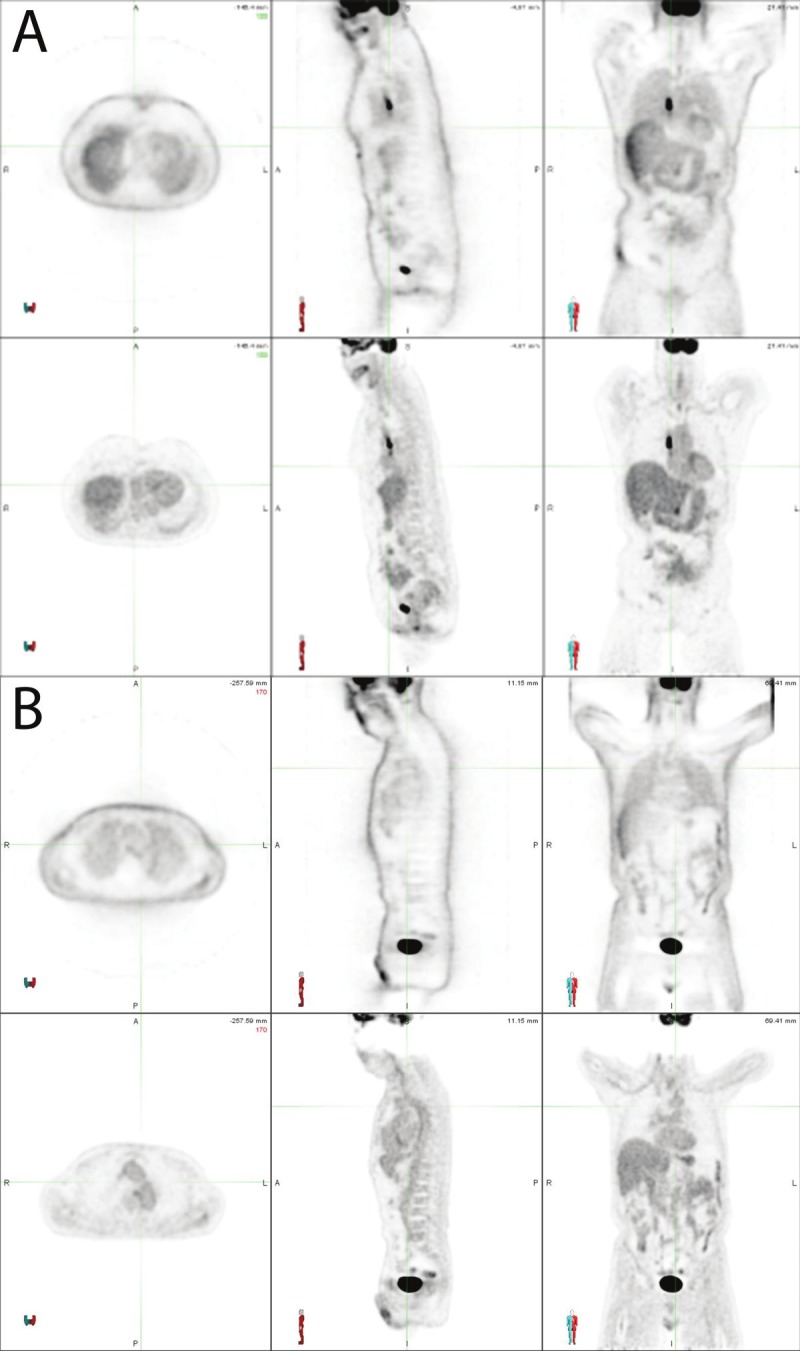
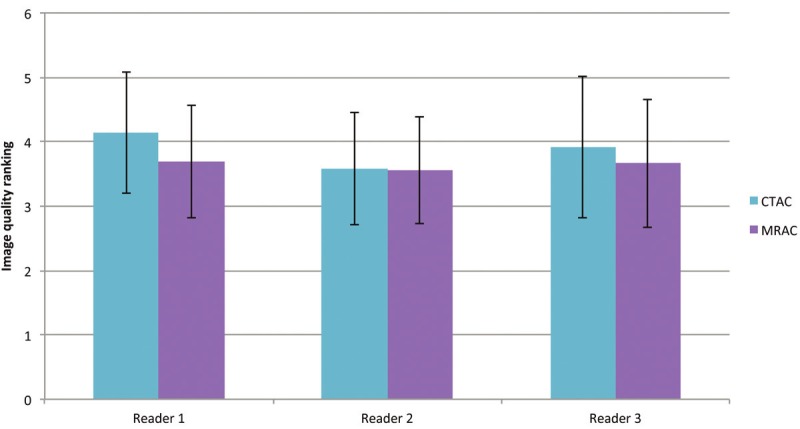
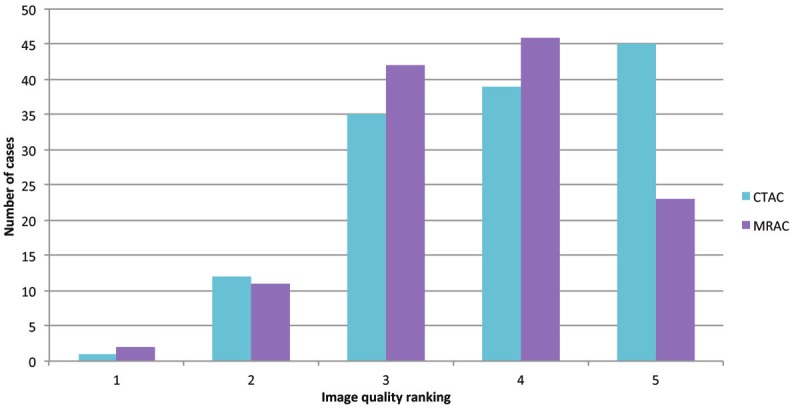
The purpose of this study is to systematically evaluate the usefulness of Positron emission tomography/Magnetic resonance imaging (PET/MRI) images in a clinical setting by assessing the image quality of Positron emission tomography (PET) images using a three-segment MR attenuation correction (MRAC) versus the standard CT attenuation correction (CTAC). We prospectively studied 48 patients who had their clinically scheduled FDG-PET/CT followed by an FDG-PET/MRI. Three nuclear radiologists evaluated the image quality of CTAC vs. MRAC using a Likert scale (five-point scale). A two-sided, paired t-test was performed for comparison purposes. The image quality was further assessed by categorizing it as acceptable (equal to 4 and 5 on the five-point Likert scale) or unacceptable (equal to 1, 2, and 3 on the five-point Likert scale) quality using the McNemar test. When assessing the image quality using the Likert scale, one reader observed a significant difference between CTAC and MRAC (p=0.0015), whereas the other readers did not observe a difference (p=0.8924 and p=0.1880, respectively). When performing the grouping analysis, no significant difference was found between CTAC vs. MRAC for any of the readers (p=0.6137 for reader 1, p=1 for reader 2, and p=0.8137 for reader 3). All three readers more often reported artifacts on the MRAC images than on the CTAC images. There was no clinically significant difference in quality between PET images generated on a PET/MRI system and those from a Positron emission tomography/Computed tomography (PET/CT) system. PET images using the automatic three-segmented MR attenuation method provided diagnostic image quality. However, future research regarding the image quality obtained using different MR attenuation based methods is warranted before PET/MRI can be used clinically.
Keywords: FDG; PET/CT; PET/MRI; attenuation correction; hybrid imaging; image quality.
Figures
Similar articles
-
Qualitative FDG PET Image Assessment Using Automated Three-Segment MR Attenuation Correction Versus CT Attenuation Correction in a Tertiary Pediatric Hospital: A Prospective Study.AJR Am J Roentgenol. 2015 Sep;205(3):652-8. doi: 10.2214/AJR.14.14231. AJR Am J Roentgenol. 2015. PMID: 26295654
-
Preclinical evaluation of MR attenuation correction versus CT attenuation correction on a sequential whole-body MR/PET scanner.Invest Radiol. 2013 May;48(5):313-22. doi: 10.1097/RLI.0b013e31827a49ba. Invest Radiol. 2013. PMID: 23296082 Free PMC article.
-
Comparison of standardized uptake values in normal structures between PET/CT and PET/MRI in an oncology patient population.Mol Imaging Biol. 2013 Dec;15(6):776-85. doi: 10.1007/s11307-013-0629-8. Mol Imaging Biol. 2013. PMID: 23632951 Free PMC article.
-
Metal artifact correction strategies in MRI-based attenuation correction in PET/MRI.BJR Open. 2019 Nov 14;1(1):20190033. doi: 10.1259/bjro.20190033. eCollection 2019. BJR Open. 2019. PMID: 33178954 Free PMC article. Review.
-
PET/MRI: a frontier in era of complementary hybrid imaging.Eur J Hybrid Imaging. 2018;2(1):12. doi: 10.1186/s41824-018-0030-6. Epub 2018 Jun 25. Eur J Hybrid Imaging. 2018. PMID: 29998214 Free PMC article. Review.
Cited by
-
MR Imaging-Guided Attenuation Correction of PET Data in PET/MR Imaging.PET Clin. 2016 Apr;11(2):129-49. doi: 10.1016/j.cpet.2015.10.002. Epub 2016 Jan 26. PET Clin. 2016. PMID: 26952727 Free PMC article. Review.
-
Comparison of Transoral and Transcervical Ultrasonography with MRI for the Diagnostic Work-Up of Oropharynx Tumors: A Protocol for a Multicenter Clinical Trial (SPOTUS).Diagnostics (Basel). 2024 Mar 8;14(6):577. doi: 10.3390/diagnostics14060577. Diagnostics (Basel). 2024. PMID: 38534997 Free PMC article.
-
Qualitative and quantitative performance of ¹⁸F-FDG-PET/MRI versus ¹⁸F-FDG-PET/CT in patients with head and neck cancer.AJNR Am J Neuroradiol. 2014 Oct;35(10):1970-5. doi: 10.3174/ajnr.A3993. Epub 2014 Jun 12. AJNR Am J Neuroradiol. 2014. PMID: 24924545 Free PMC article.
-
Fully automated breast segmentation on spiral breast computed tomography images.J Appl Clin Med Phys. 2022 Oct;23(10):e13726. doi: 10.1002/acm2.13726. Epub 2022 Aug 9. J Appl Clin Med Phys. 2022. PMID: 35946049 Free PMC article.
-
A novel read methodology to evaluate the optimal dose of 68Ga-satoreotide trizoxetan as a PET imaging agent in patients with gastroenteropancreatic neuroendocrine tumours: a phase II clinical trial.EJNMMI Res. 2021 Sep 6;11(1):84. doi: 10.1186/s13550-021-00819-1. EJNMMI Res. 2021. PMID: 34487283 Free PMC article.
References
-
- Schulz V, Torres-Espallardo I, Renisch S, Hu Z, Ojha N, Börnert P, Perkuhn M, Niendorf T, Schäfer WM, Brockmann H, Krohn T, Buhl A, Günther RW, Mottaghy FM, Krombach GA. Automatic, three-segment, MR-based attenuation correction for whole-body PET/MR data. Eur J Nucl Med Mol Imaging. 2011;38:138–152. - PubMed
-
- Antoch G, Vogt FM, Freudenberg LS, Nazaradeh F, Goehde SC, Barkhausen J, Dahmen G, Bockisch A, Debatin JF, Ruehm SG. Whole-body dual-modality PET/CT and whole-body MRI for tumor staging in oncology. JAMA. 2003;290:3199–3206. - PubMed
-
- Dixon WT. Simple proton spectroscopic imaging. Radiology. 1984;153:189–194. - PubMed
-
- Turkbey B, Aras O, Karabulut N, Turgut AT, Akpinar E, Alibek S, Pang Y, Erturk SM, Khouli El RH, Bluemke DA, Choyke PL. Diffusion weighted MRI for detecting and monitoring cancer: a review of current applications in body imaging. Diagn Interv Radiol. 2012;18:46–59. - PubMed
LinkOut - more resources
Full Text Sources