Na(+)/Ca(2+) selectivity in the bacterial voltage-gated sodium channel NavAb
- PMID: 23638350
- PMCID: PMC3629057
- DOI: 10.7717/peerj.16
Na(+)/Ca(2+) selectivity in the bacterial voltage-gated sodium channel NavAb
Abstract
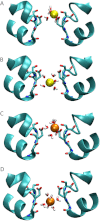
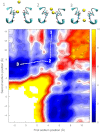
The recent publication of a number of high resolution bacterial voltage-gated sodium channel structures has opened the door for the mechanisms employed by these channels to distinguish between ions to be elucidated. The way these channels select between Na(+) and K(+) has been investigated in computational studies, but the selectivity for Na(+) over Ca(2+) has not yet been studied in this way. Here we use molecular dynamics simulations to calculate the energetics of Na(+) and Ca(2+) transport through the channel. Single ion profiles show that Ca(2+) experiences a large barrier midway through the selectivity filter that is not seen by Na(+). This barrier is caused by the need for Ca(2+) to partly dehydrate to pass through this region and the lack of compensating interactions with the protein. Multi-ion profiles show that ions can pass each other in the channel, which is why the presence of Ca(2+) does not block Na(+) conduction despite binding more strongly in the pore.
Keywords: Action potential; Bacterial channel; Calcium channel; Ion channel; Ion selectivity; Molecular dynamics; Simulation; Sodium channel.
Figures


Similar articles
-
Simulation Studies of Ion Permeation and Selectivity in Voltage-Gated Sodium Channels.Curr Top Membr. 2016;78:215-60. doi: 10.1016/bs.ctm.2016.07.005. Epub 2016 Aug 3. Curr Top Membr. 2016. PMID: 27586286 Review.
-
Ion conduction and conformational flexibility of a bacterial voltage-gated sodium channel.Proc Natl Acad Sci U S A. 2014 Mar 4;111(9):3454-9. doi: 10.1073/pnas.1320907111. Epub 2014 Feb 18. Proc Natl Acad Sci U S A. 2014. PMID: 24550503 Free PMC article.
-
A native prokaryotic voltage-dependent calcium channel with a novel selectivity filter sequence.Elife. 2020 Feb 25;9:e52828. doi: 10.7554/eLife.52828. Elife. 2020. PMID: 32093827 Free PMC article.
-
Selective ion permeation involves complexation with carboxylates and lysine in a model human sodium channel.PLoS Comput Biol. 2018 Sep 12;14(9):e1006398. doi: 10.1371/journal.pcbi.1006398. eCollection 2018 Sep. PLoS Comput Biol. 2018. PMID: 30208027 Free PMC article.
-
Molecular pore structure of voltage-gated sodium and calcium channels.Braz J Med Biol Res. 1994 Dec;27(12):2781-802. Braz J Med Biol Res. 1994. PMID: 7550000 Review.
Cited by
-
Investigating the size and dynamics of voltage-gated sodium channel fenestrations.Channels (Austin). 2014;8(3):264-77. doi: 10.4161/chan.28136. Channels (Austin). 2014. PMID: 24632677 Free PMC article.
-
Role of the Interaction Motif in Maintaining the Open Gate of an Open Sodium Channel.Biophys J. 2018 Nov 20;115(10):1920-1930. doi: 10.1016/j.bpj.2018.10.001. Epub 2018 Oct 4. Biophys J. 2018. PMID: 30366630 Free PMC article.
-
K+ Block Is the Mechanism of Functional Asymmetry in Bacterial Na(v) Channels.PLoS Comput Biol. 2016 Jan 4;12(1):e1004482. doi: 10.1371/journal.pcbi.1004482. eCollection 2016 Jan. PLoS Comput Biol. 2016. PMID: 26727271 Free PMC article.
-
The mechanism of Na⁺/K⁺ selectivity in mammalian voltage-gated sodium channels based on molecular dynamics simulation.Biophys J. 2013 Jun 4;104(11):2401-9. doi: 10.1016/j.bpj.2013.04.035. Biophys J. 2013. PMID: 23746512 Free PMC article.
-
Locating the route of entry and binding sites of benzocaine and phenytoin in a bacterial voltage gated sodium channel.PLoS Comput Biol. 2014 Jul 3;10(7):e1003688. doi: 10.1371/journal.pcbi.1003688. eCollection 2014 Jul. PLoS Comput Biol. 2014. PMID: 24992293 Free PMC article.
References
-
- Bako I, Hutter J, Palinkas G. Car–Parrinello molecular dynamics simulation of the hydrated calcium ion. Journal of Chemical Physics. 2002;117:9838–9843. doi: 10.1063/1.1517039. - DOI
LinkOut - more resources
Full Text Sources
Other Literature Sources
Miscellaneous

