

Iodine nutrition and toxicity in Atlantic cod (Gadus morhua) larvae
- PMID: 23638355
- PMCID: PMC3628846
- DOI: 10.7717/peerj.20
Iodine nutrition and toxicity in Atlantic cod (Gadus morhua) larvae
Abstract
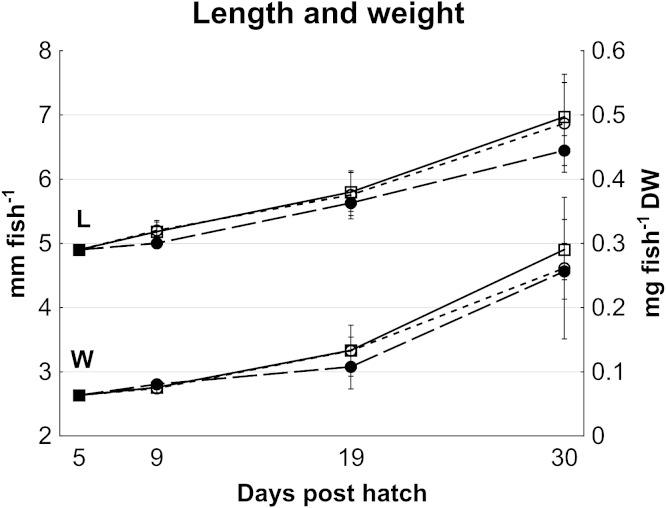
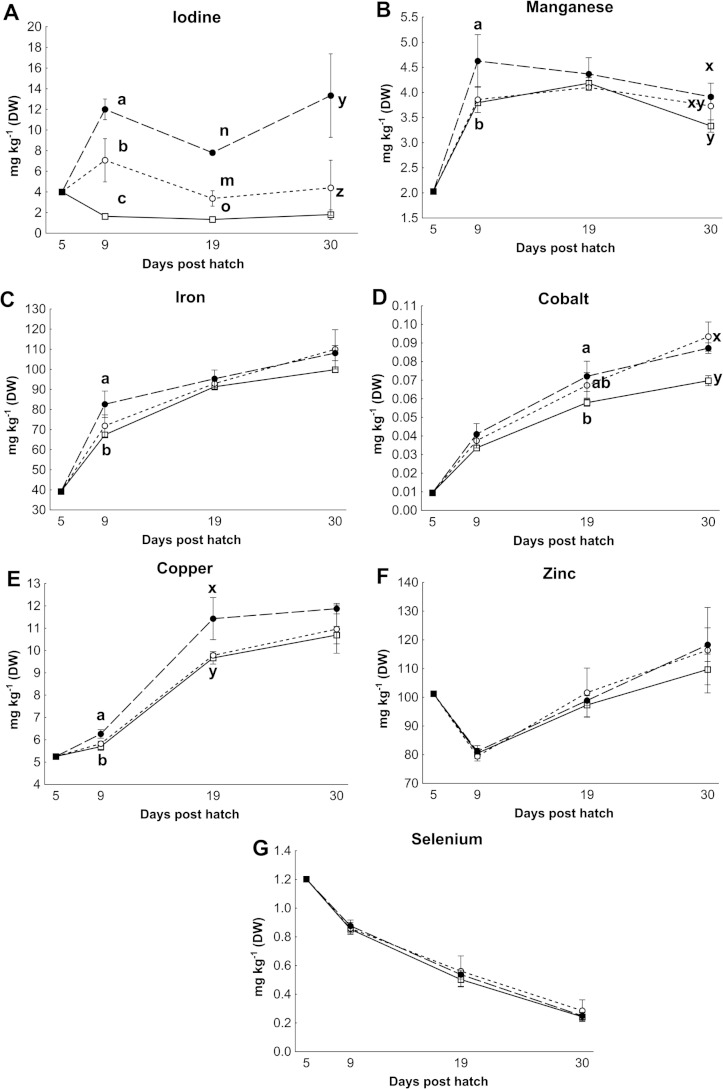
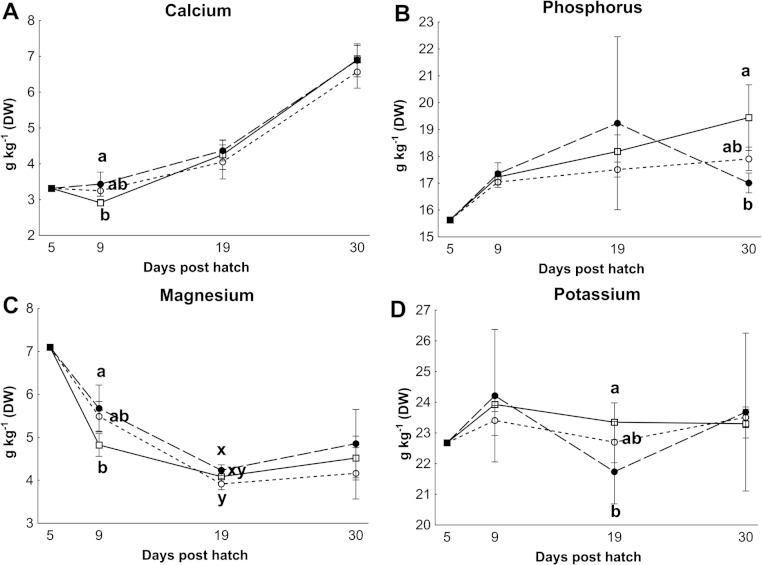
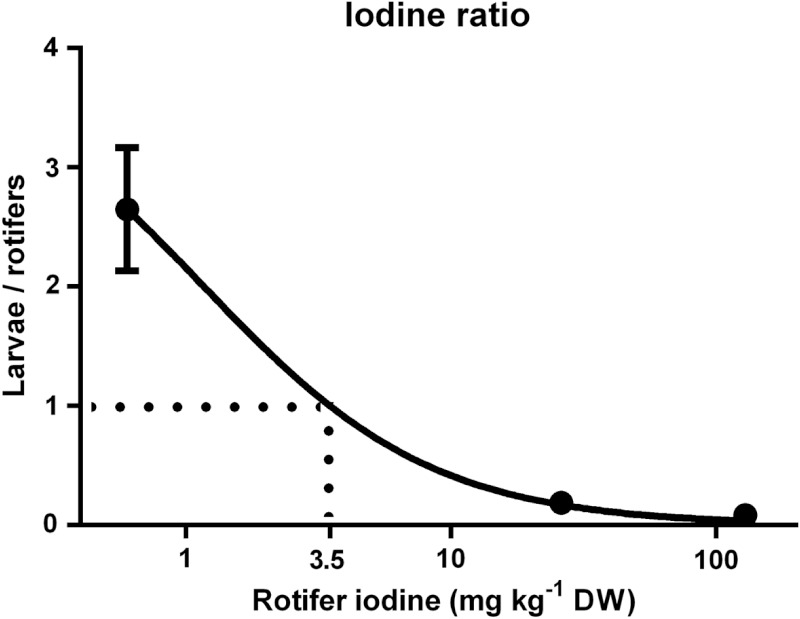
Copepods as feed promote better growth and development in marine fish larvae than rotifers. However, unlike rotifers, copepods contain several minerals such as iodine (I), at potentially toxic levels. Iodine is an essential trace element and both under and over supply of I can inhibit the production of the I containing thyroid hormones. It is unknown whether marine fish larvae require copepod levels of I or if mechanisms are present that prevent I toxicity. In this study, larval Atlantic cod (Gadus morhua) were fed rotifers enriched to intermediate (26 mg I kg(-1) dry weight; MI group) or copepod (129 mg I kg(-1) DW; HI group) I levels and compared to cod larvae fed control rotifers (0.6 mg I kg(-1) DW). Larval I concentrations were increased by 3 (MI) and 7 (HI) fold compared to controls during the rotifer feeding period. No differences in growth were observed, but the HI diet increased thyroid follicle colloid to epithelium ratios, and affected the essential element concentrations of larvae compared to the other groups. The thyroid follicle morphology in the HI larvae is typical of colloid goitre, a condition resulting from excessive I intake, even though whole body I levels were below those found previously in copepod fed cod larvae. This is the first observation of dietary induced I toxicity in fish, and suggests I toxicity may be determined to a greater extent by bioavailability and nutrient interactions than by total body I concentrations in fish larvae. Rotifers with 0.6 mg I kg(-1) DW appeared sufficient to prevent gross signs of I deficiency in cod larvae reared with continuous water exchange, while modelling of cod larvae versus rotifer I levels suggests that optimum I levels in rotifers for cod larvae is 3.5 mg I kg(-1) DW.
Keywords: Cod larvae; Colloid goitre; Fish larvae; Iodine requirement; Iodine toxicity; Mineral interactions; Rotifers; Thyroid follicles; Thyroid hormones.
Figures
Similar articles
-
Copepods enhance nutritional status, growth and development in Atlantic cod (Gadus morhua L.) larvae - can we identify the underlying factors?PeerJ. 2015 May 19;3:e902. doi: 10.7717/peerj.902. eCollection 2015. PeerJ. 2015. PMID: 26038712 Free PMC article.
-
Transcriptome profiling reveals that feeding wild zooplankton to larval Atlantic cod (Gadus morhua) influences suites of genes involved in oxidation-reduction, mitosis, and selenium homeostasis.BMC Genomics. 2015 Nov 26;16:1016. doi: 10.1186/s12864-015-2120-1. BMC Genomics. 2015. PMID: 26610852 Free PMC article.
-
Diet affects the redox system in developing Atlantic cod (Gadus morhua) larvae.Redox Biol. 2015 Aug;5:308-318. doi: 10.1016/j.redox.2015.06.003. Epub 2015 Jun 12. Redox Biol. 2015. PMID: 26099546 Free PMC article.
-
Skeletal muscle growth dynamics and the influence of first-feeding diet in Atlantic cod larvae (Gadus morhua L.).Biol Open. 2016 Nov 15;5(11):1575-1584. doi: 10.1242/bio.018556. Biol Open. 2016. PMID: 27612513 Free PMC article.
-
Expression of the oligopeptide transporter, PepT1, in larval Atlantic cod (Gadus morhua).Comp Biochem Physiol B Biochem Mol Biol. 2008 Jun;150(2):177-82. doi: 10.1016/j.cbpb.2008.02.011. Epub 2008 Mar 5. Comp Biochem Physiol B Biochem Mol Biol. 2008. PMID: 18396432
Cited by
-
Copepods enhance nutritional status, growth and development in Atlantic cod (Gadus morhua L.) larvae - can we identify the underlying factors?PeerJ. 2015 May 19;3:e902. doi: 10.7717/peerj.902. eCollection 2015. PeerJ. 2015. PMID: 26038712 Free PMC article.
-
Nutrition and Metabolism of Minerals in Fish.Animals (Basel). 2021 Sep 16;11(9):2711. doi: 10.3390/ani11092711. Animals (Basel). 2021. PMID: 34573676 Free PMC article. Review.
-
Growth Performance, Nutrient Digestibility, and Retention in Atlantic Salmon, Salmo salar L., Fed Diets with Fermented Sugar Kelp, Saccharina latissima.Aquac Nutr. 2023 Nov 29;2023:6664947. doi: 10.1155/2023/6664947. eCollection 2023. Aquac Nutr. 2023. PMID: 38077278 Free PMC article.
-
Transcriptome profiling reveals that feeding wild zooplankton to larval Atlantic cod (Gadus morhua) influences suites of genes involved in oxidation-reduction, mitosis, and selenium homeostasis.BMC Genomics. 2015 Nov 26;16:1016. doi: 10.1186/s12864-015-2120-1. BMC Genomics. 2015. PMID: 26610852 Free PMC article.
-
Chemical characterization of 21 species of marine macroalgae common in Norwegian waters: benefits of and limitations to their potential use in food and feed.J Sci Food Agric. 2018 Mar;98(5):2035-2042. doi: 10.1002/jsfa.8798. Epub 2018 Jan 18. J Sci Food Agric. 2018. PMID: 29193189 Free PMC article.
References
-
- Arafa EA, Bejey AM, Etwir RH, Das HA. Determination of iodine and bromine in fish samples by radiochemical neutron activation analysis. Journal of Trace and Microprobe Techniques. 2000;18(3):461–466.
-
- Baeverfjord G, Hjelde K, Helland S, Lein I. Malformations in farmed fish. Guidelines for classification; II. Cod (Gadus morhua). Available at http://www.aquatour.info/FileLibrary%5C28%5CCod%20diagnostic%20manual.pdf. (accessed 15 November 2012)
-
- Baker DH. Problems and pitfalls in animal experiments designed to establish dietary requirements for essential nutrients. Journal of Nutrition. 1986;116(12):2339–2349. - PubMed
-
- Baker DH. Iodine toxicity and its amelioration. Experimental Biology and Medicine. 2004;229(6):473–478. - PubMed
-
- Baker DH, Parr TM, Augspurger NR. Oral iodine toxicity in chicks can be reversed by supplemental bromine. Journal of Nutrition. 2003;133(7):2309–2312. - PubMed
LinkOut - more resources
Full Text Sources
Other Literature Sources
