. 2013 Sep;19(17-18):2045-62.
doi: 10.1089/ten.TEA.2012.0250. Epub 2013 Jun 11.

Production and assessment of decellularized pig and human lung scaffolds

Affiliations

Production and assessment of decellularized pig and human lung scaffolds

Joan E Nichols et al. Tissue Eng Part A. 2013 Sep.

Abstract

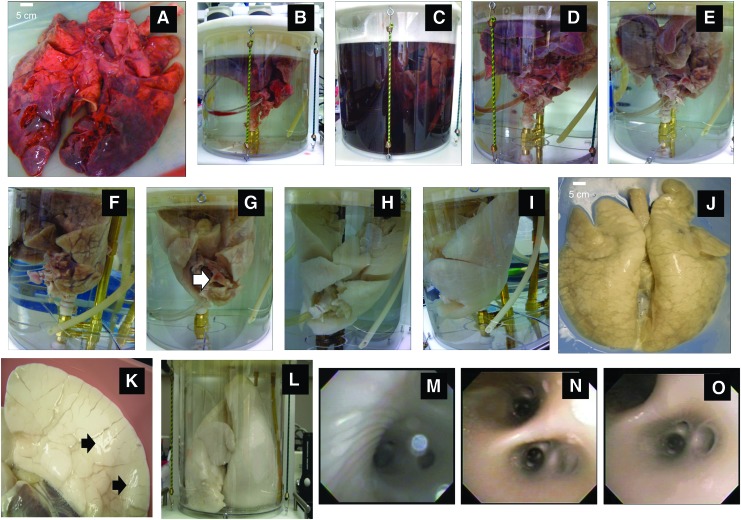
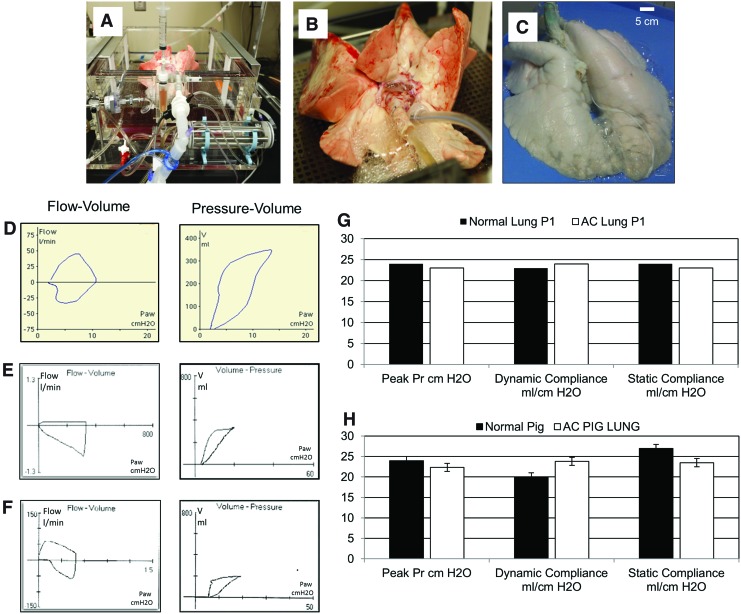
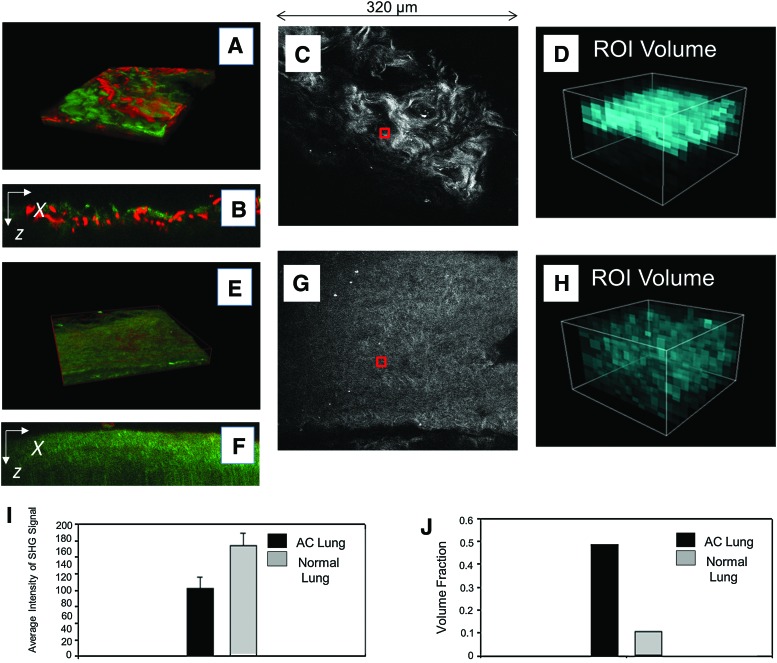
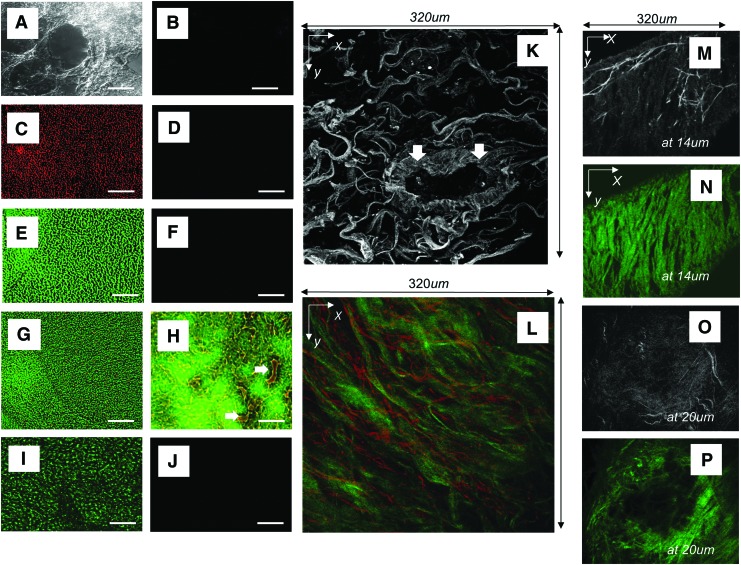
The authors have previously shown that acellular (AC) trachea-lung scaffolds can (1) be produced from natural rat lungs, (2) retain critical components of the extracellular matrix (ECM) such as collagen-1 and elastin, and (3) be used to produce lung tissue after recellularization with murine embryonic stem cells. The aim of this study was to produce large (porcine or human) AC lung scaffolds to determine the feasibility of producing scaffolds with potential clinical applicability. We report here the first attempt to produce AC pig or human trachea-lung scaffold. Using a combination of freezing and sodium dodecyl sulfate washes, pig trachea-lungs and human trachea-lungs were decellularized. Once decellularization was complete we evaluated the structural integrity of the AC lung scaffolds using bronchoscopy, multiphoton microscopy (MPM), assessment of the ECM utilizing immunocytochemistry and evaluation of mechanics through the use of pulmonary function tests (PFTs). Immunocytochemistry indicated that there was loss of collagen type IV and laminin in the AC lung scaffold, but retention of collagen-1, elastin, and fibronectin in some regions. MPM scoring was also used to examine the AC lung scaffold ECM structure and to evaluate the amount of collagen I in normal and AC lung. MPM was used to examine the physical arrangement of collagen-1 and elastin in the pleura, distal lung, lung borders, and trachea or bronchi. MPM and bronchoscopy of trachea and lung tissues showed that no cells or cell debris remained in the AC scaffolds. PFT measurements of the trachea-lungs showed no relevant differences in peak pressure, dynamic or static compliance, and a nonrestricted flow pattern in AC compared to normal lungs. Although there were changes in content of collagen I and elastin this did not affect the mechanics of lung function as evidenced by normal PFT values. When repopulated with a variety of stem or adult cells including human adult primary alveolar epithelial type II cells both pig and human AC scaffolds supported cell attachment and cell viability. Examination of scaffolds produced using a variety of detergents indicated that detergent choice influenced human immune response in terms of T cell activation and chemokine production.


Figures

FIG. 1.
FIG. 1.
Processing procedure for the decellularization of a whole pig trachea-lung. (A) Whole pig lung prior to processing. (B) Placement of cannulas into trachea and PA. (C) Start of decellularization process on day 1 showing discoloration of the SDS in the tank due to the presence of hemolyzed blood and cell debris. (D) Day 2 of process. (E) Day 3 of process. (F) Day 4 of process. Note the white regions where decellularization has taken place. (G) Day 5 of process. Note white arrow showing regions near the carina that have not been fully decellularized. (H) Day 6 of process. (I) Day 7 of process and (J) completely decellularized lung removed from tank on day 7, anterior view. (K) Posterior view of one lobe showing sites of fibrin glue repair of pleura (black arrows). (L) Lungs were expanded to examine elasticity and for PFT testing. (M) Bronchoscopic examination of main stem bronchus and branching airways and (N, O) use of same scope to view branching vessels of AC lung scaffold. SDS, sodium dodecyl sulfate; PFT, pulmonary function testing; AC, acellular; PA, pulmonary artery. Color images available online at www.liebertpub.com/tea
FIG. 2.
FIG. 2.
Evaluation of mechanics of lung function (A) Harvard Apparatus-ventilator system supporting a whole pig lung. (B) Close-up image of pig lung in panel (A) showing placement of endotracheal tube and cannula into PA. (C) Whole AC pig lung attached by endotracheal tube to ventilator. (D) Measurements of flow-volume loop (left) and pressure-volume loop (right) for lung shown in panels (A) and (B) above. (E) Measurement of flow-volume loop (left) and pressure-volume loop (right) for AC pig lung shown in panel (C). (F) Measurements of flow-volume loop (left) and pressure-volume loop (right) for live pig being maintained on a ventilator. (G) Representative examination of the peak pressure, dynamic compliance, and static compliance for a single pig lung pre (■) and post (□) decellularization. (H) Averaged data for peak pressure, dynamic compliance, and static compliance for n=8 pig lungs measured pre (■) and post (□) decellularization. Color images available online at www.liebertpub.com/tea
FIG. 3.
FIG. 3.
MPM-SHG scoring of pig normal versus AC lung. (A) MPM 3D reconstruction image of normal lung ECM using SHG to image collagen (green) and AF for elastin (red). (B) Single XZ cross section of A. (C) A scored ROI (red box) is shown for normal pig lung. (D) Volumetric representation of the distribution of the collagen SHG intensity of the region denoted by red box in (C). (E) MPM 3D reconstruction image of AC pig lung ECM using SHG to image collagen (green) and AF for elastin (red). (F) Single XZ cross section of (E). (G) A representative scored ROI (red box) is shown for AC pig lung. (H) Volumetric representation of the distribution of the collagen SHG intensity of the region denoted by red box in (G). (I) Averaged scoring results for normal versus AC lung based on the average of the SHG intensity from each case. (J) Volume fraction of the SHG signal in normal versus AC lung showing that although the intensity of SHG is higher in the native lung, the distribution of collagen is more uniform in the AC lung. MPM, multiphoton microscopy; AF, autofluorescence; SHG, second harmonic generation; ECM, extracellular matrix; ROI, region of interest; 3D, three-dimensional. Color images available online at www.liebertpub.com/tea
FIG. 4.
FIG. 4.
Evaluation of AC pig pleura. (A) Phase contrast microscopic image of AC pig pleura, scale bar=100 μm. (B) Evaluation of presence of nuclei, nuclear material using DAPI, or cell debris by staining for pig MHC-1, scale bar=100 μm. (C) Staining control for (D) and (E). (D) Staining for presence of elastin (red) and (E) Collagen (green), scale bar=100 μm. (F) Merge of (B) and (D), scale bar=100 μm. (G) MPM image of pleura using combined AF of elastin (red) and SHG of collagen (green). (H) 90° (XZ) cross-sectional view of (G). White arrows indicate elastin fibers between collagen bands. (I) MPM AF image of pleura using MPM showing bright elastin fibers. (J) Single XZ cross section of I showing depth-resolved structure obtained by AF. DAPI, 4′,6-diamidino-2-phenylindole, dihydrochloride; MHC, major histocompatibility complex-1. Color images available online at www.liebertpub.com/tea
FIG. 5.
FIG. 5.
Evaluation of AC pig distal lung. (A) Phase contrast microscopic image of AC pig distal lung, scale bar=100 μm. (B) Evaluation of presence of nuclei, nuclear material using DAPI, or cell debris by staining for pig MHC-1. (C) Staining for presence of elastin (red), scale bar=100 μm. (D) Staining control for (C). (E) Staining for the presence of collagen (green), scale bar=100 μm. (F) Staining control for (E). (G) Merge of (C) and (E), scale bar=100 μm. (H) Merge of section stained for elastin (red) and collagen (green) showing that ECM of small blood vessels remains intact, scale bar=100 μm. White arrows point to blood vessels in AC distal lung. (I) Staining for presence of fibronectin (green), scale bar=10 μm. (J) Staining control for (I). (K) MPM images of distal lung using AF for elastin. White arrows point to ECM of a blood vessel in cross section. (L) MPM z-projection of distal lung using combined AF and SHG showing elastin fibers (red) and bundles of collagen (green) imaged to a depth of 140 μm. (M, N) Border of AC distal lung using AF at a depth of 14 μm at edge of distal lung indicating high elastin content. (M) Bright elastin fibers amid lower intensity collagen (grey background), and (N) corresponding SHG of same area in panel (M) showing the signal specific to bundles of collagen fibers (green). (O) MPM AF at a depth of 20 μm of small bronchiole showing bright elastin fibers and gray background (collagen). (P) SHG of same area in (O) showing bundles of collagen fibers (green). Color images available online at www.liebertpub.com/tea
FIG. 6.
FIG. 6.
Production and evaluation of AC human trachea-lung. (A) Image of bioreactor containing an adult trachea-lung. (B) Gross image of an AC pediatric trachea-human lung and (C) AC main stem bronchus and lobe of an adult lung. (D, E) Bronchoscopic views imaged through right main stem bronchus of the adult AC lobe in panel (C) showing the branching airway. (F, G) Use of a bronchoscope to view the PA showing branching of blood vessels. (H, I) PFTs showing (H) normal human ventilation profiles with flow-volume loop (left) and volume-pressure loops (right). (I) PFTs of AC human lung showing ventilation profiles and flow-volume loop (left) and volume-pressure loops (right). (J) Averaged data for peak pressure, dynamic compliance, and static compliance for n=6 adult human lungs measured pre (formula image) and post (formula image) decellularization. Color images available online at www.liebertpub.com/tea
FIG. 7.
FIG. 7.
MPM-SHG scoring of human normal versus AC lung. MPM evaluation of normal lung (A–D). (A) MPM 3D reconstruction image of normal lung ECM using SHG to image collagen (green) and AF for elastin (red). (B) Single XZ cross section of (A). (C) SHG to visualize collagen of normal lung. A scored ROI (red box) is shown. (D) Volumetric representation of the distribution of the collagen using SHG intensity of the region denoted by red box in (C). (E–H) MPM evaluation of AC lung. (E) MPM 3D reconstruction image of AC human lung using SHG to image collagen (green) and AF for elastin (red). (F) Single XZ cross section of E. (G) SHG was used to visualize collagen. A scored ROI (red box) is shown for AC human lung. (H) Volumetric representation of the distribution of the collagen SHG intensity of the region denoted by red box in (G). (I) Averaged scoring results for normal versus AC lung based on the average of the SHG intensity from each case. (J) Volume fraction of the SHG signal in normal versus AC lung showing that although the intensity of SHG is higher in the native lung, the distribution of collagen is more uniform in the AC lung. Color images available online at www.liebertpub.com/tea
FIG. 8.
FIG. 8.
Evaluation of AC human distal lung. (A) Phase contrast microscopic image of AC distal lung, scale bar=100 μm. (B) Evaluation of presence of nuclei and nuclear material using DAPI. (C) Staining for presence of elastin (red), scale bar=100 μm. (D) Staining control for C. (E) Staining for presence of collagen (green) and cell nuclei using DAPI (blue), scale bar=100 μm. (F) Staining control for (E). (G) Merge of (C) and (E), scale bar=100 μm. (H) Evaluation of cell debris using staining for human MHC-1 (green) in AC distal lung, scale bar=100 μm. (I) Staining for fibronectin (green), scale bar=100 μm. (J) Staining control for (I). (K) MPM images of distal lung using combined AF with SHG for elastin (red) and collagen (green). (L) 90° (XZ) cross-sectional view of (K). Color images available online at www.liebertpub.com/tea
FIG. 9.
FIG. 9.
Post production DNA content evaluation and assessment of cell viability. (A) Evaluation of residual DNA in a normal human lung pre-decellularization and for one representative human lung post decellularization. (B) MPM z-projection of distal recellularized AC Pig lung showing AF arising from elastin fibers and cells (red) and SHG from collagen (green). Cells are also designated by white arrows. (C) 90° (XZ) cross-sectional view of (B). Note cells (red) attached to the ECM. (D) DAPI staining of normal lung. (E, F, G) DAPI staining of MESC nuclei (blue) cultured for 7 days or cells cultured on (E) AC pig lung scaffold, (F) Gelfoam or (G) Matrigel. (H, I, J) DAPI staining of HFLC nuclei (blue) cultured on (H) AC pig lung, (I) Gelfoam or (J) Matrigel. (K, L, M) DAPI staining of nuclei of pig BMMSC cultured on (K) AC pig lung, (L) Gelfoam or (M) Matrigel. (N–Q) Averaged data for evaluation of total number of cells and number of viable cells harvested at 7 days from each scaffold material. Average number of total cells and viable cells at 7 days for (N) MESC, (O) BMMSC, (P) HFLC, or (Q) HAEC after culture on AC pig lung, AC human lung, Gelfoam or Matrigel scaffolds. Both AC pig lung and AC human lung had significantly more cells and viable cells at 7 days of culture than either Gelfoam or Matrigel (*p<0.05). HAEC AC pig and AC human scaffold constructs also yielded significantly more intact primary HAEC and more viable HAEC than plate culture (*p<0.05). MESC, murine embryonic stem cells; BMMSC, bone marrow-derived pig mesenchymal stem cells; HFLC, human fetal lung cells; HAEC, human alveolar epithelial type II cells. Color images available online at www.liebertpub.com/tea
FIG. 10.
FIG. 10.
Human alveolar epithelial cell culture (A) H&E of HAEC cultured for 7 days on AC human lung, scale bar=100 μm. (B) H& E of HAEC cultured for 7 days on AC human lung, scale bar=50 μm. (C) Examination of section of HAEC on human lung, day 1 post seeding of cells, stained to show pro-SPC (red). Scale bar=50 μm (D) Examination of section of HAEC on human lung, day 1 post seeding of cells, stained to show pro-SPC (red) showing cell adhesion on portions of scaffold. Scale bar=50 μm (E) Staining control for panel (F). Scale bar=5 μm. (F) Examination of section of HAEC on human lung, 5 days post seeding of cells, stained to show pro-SPC (green). Scale bar=10 μm. (G) Examination of section of HAEC on human lung, 7 days post seeding of cells, stained to show pro-SPC (red). Scale bar=5 μm. (H) Section of HAEC on AC human lung scaffold, 7 days post seeding of cells, stained to show pro-SPC (green) and aquaporin 5 (red). Scale bar=5 μm. (I) Staining control for (C–H). Scale bar=10 μm. pro-SPC, pro surfactant protein C. Color images available online at www.liebertpub.com/tea
FIG. 11.
FIG. 11.
Post production assessment of primary HAEC cultured on AC human scaffolds produced using different detergents. (A) Averaged data for evaluation of total number of cells and number of viable primary HAEC harvested at 7 days from scaffolds produced using different detergents. (B) Apoptosis was measured for cells isolated from HAEC/scaffold constructs produced on scaffolds generated using different detergents following 5, 7 or 14 days of decellularization treatment. Significantly less apoptosis was seen for AECs cultured on scaffolds produced using 1% SDS for 5 or 7 days (*p<0.05) than for scaffolds produced using other detergents.
FIG. 12.
FIG. 12.
Post production assessment of human immune cell activation. (A) Culture of human MNL with human AC distal lung produced using 1% SDS, 0.1% SDS, 8 mM CHAPS, and 0.1% Triton X-100 followed by 2% Deoxycholate or 3% Triton X-100 detergents to determine activation of CD3 T Cells. Values from cells isolated from triplicate cultures for each scaffold were averaged to determine loss of CFSE label. Human lung scaffold produced using 1% SDS induced significantly less activation of human MNLs than did scaffolds produced using other detergents. (*p<0.05). (B) Examination of chemokine production by MNLs cultured with AC human lung scaffolds produced using different detergents. Lung scaffold produced using 1% SDS induced significantly lower levels of chemokines than did culture of MNLS with AC human lung scaffolds produced using other detergents (*p<0.05). MNL, mononuclear leukocytes; CFSE, carboxyfluorescein succinimidyl ester.

References

    1. McCurry K.R. Shearon T.H. Edwards L.B. Chan K.M. Sweet S.C. Valapour M. Yusen R. Murray S. Lung transplantation in the United States, 1998–2007. Am J Transplant. 2009;9:942. - PubMed
    1. Studer S.M. Levy R.D. McNeil K. Orens J.B. Lung transplant outcomes: a review of survival, graft function, physiology, health-related quality of life and cost-effectiveness. Eur Respir J. 2004;24:674. - PubMed
    1. Zych B. Popov A.F. Stavri G. Bashford A. Bahrami T. Amrani M. De Robertis F. Carby M. Marczin N. Simon A.R. Redmond K.C. Early outcomes of bilateral sequential single lung transplantation after ex-vivo lung evaluation and reconditioning. J Heart Lung Transplant. 2012;31:274. - PubMed
    1. U.S. Organ and Transplantation Network and the Scientific Registry of Transplant Recipients. OPTN/SRTR annual report. 2009. http://optn.transplant.hrsa.gov/ar2009/ http://optn.transplant.hrsa.gov/ar2009/
    1. Medeiros I.L. Pego-Fernandes P.M. Mariani A.W. Fernandes F.G. do Vale Unterpertinger F. Canzian M. Jatene F.B. Histologic and functional evaluation of lungs reconditioned by ex vivo lung perfusion. J Heart Lung Transplant. 2012;31:305. - PubMed

Publication types