. 2013 May 2:10:49.
doi: 10.1186/1742-4690-10-49.

Within-host and between-host evolutionary rates across the HIV-1 genome

Affiliations

Within-host and between-host evolutionary rates across the HIV-1 genome

Samuel Alizon et al. Retrovirology. .

Abstract

Background: HIV evolves rapidly at the epidemiological level but also at the within-host level. The virus' within-host evolutionary rates have been argued to be much higher than its between-host evolutionary rates. However, this conclusion relies on analyses of a short portion of the virus envelope gene. Here, we study in detail these evolutionary rates across the HIV genome.

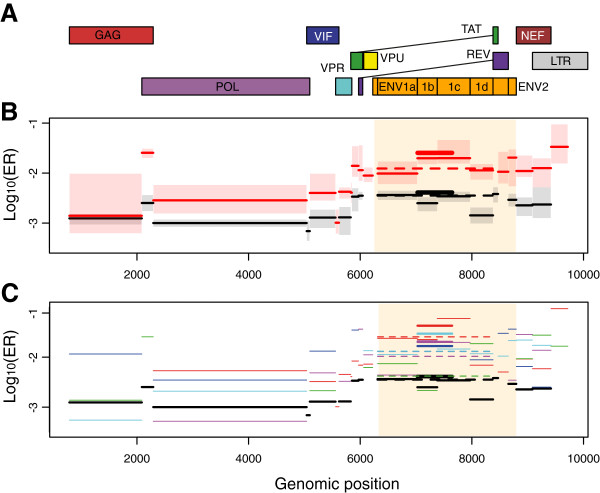
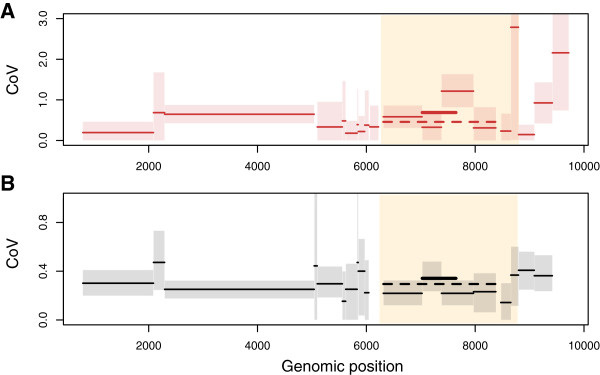
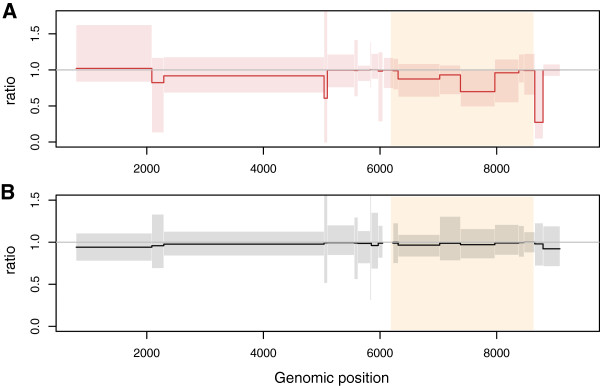
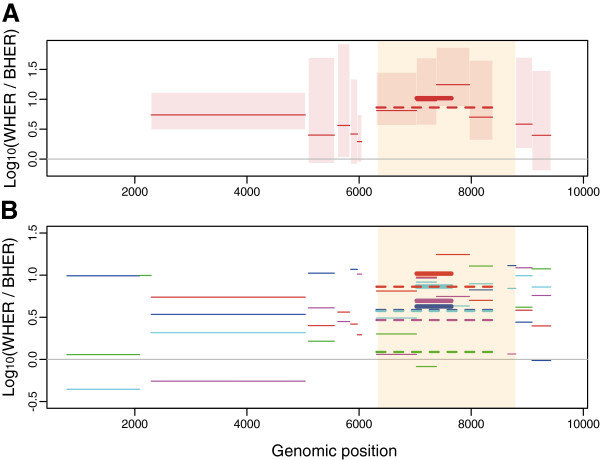
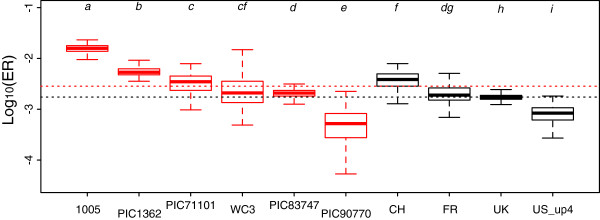
Results: We build phylogenies using a relaxed molecular clock assumption to estimate evolutionary rates in different regions of the HIV genome. We find that these rates vary strongly across the genome, with higher rates in the envelope gene (env). Within-host evolutionary rates are consistently higher than between-host rates throughout the HIV genome. This difference is significantly more pronounced in env. Finally, we find weak differences between overlapping and non-overlapping regions.

Conclusions: We provide a genome-wide overview of the differences in the HIV rates of molecular evolution at the within- and between-host levels. Contrary to hepatitis C virus, where differences are only located in the envelope gene, within-host evolutionary rates are higher than between-host evolutionary rates across the whole HIV genome. This supports the hypothesis that HIV strains that are less adapted to the host have an advantage during transmission. The most likely mechanism for this is storage and then preferential transmission of viruses in latent T-cells. These results shed a new light on the role of the transmission bottleneck in the evolutionary dynamics of HIV.


Figures

Figure 1
Figure 1
Evolutionary rates (ER) throughout the HIV genome within- and between-hosts. A) HIV genome, B) Median evolutionary rates for the pooled WH data (in red) and BH data (in black) and C) Median evolutionary rates for all the datasets. In panel B, shaded boxes indicate 50% credibility intervals. The thick line shows the C2V5 region (studied by former studies) and the dashed line the ENV1 segment. The env gene is highlighted in yellow. In panel C, the colour code is red for PIC1362, green for PIC38417, blue for PIC71101, cyan for PIC83747, purple for PIC90770 and black for the BH data (UP-up4).
Figure 2
Figure 2
Coefficient of variation statistics (scaled variance in evolutionary rate among lineages). A) In patient PIC1362 and B) in the BH dataset US-up4. Shaded boxes indicate the range of the 95% Highest Posterior Density (HPD). The thick line shows the C2V5 region (studied by former studies) and the dashed line the ENV1 segment. The env gene is highlighted in yellow.
Figure 3
Figure 3
Ratio between the substitution rate estimated on internal branches and that estimated on external branches. A) In patient PIC1362 and B) in the BH dataset US-up4. The grey horizontal line indicates equal evolutionary rates on internal and external branches. Shaded boxes indicate the 95% confidence interval. The env gene is highlighted in yellow.
Figure 4
Figure 4
Log of the ratio between the median ER measured WH and BH. A) In patient PIC1362 and B) for all the datasets. In panel A, the boxes are the 95% confidence interval. The thick line indicates the C2V5 segment (studied by earlier studies) and the thick dashed line indicates the whole ENV1 segment. In panel B, the colour code is the same as in Figure 3. In the env gene (the shaded yellow area) the ratio between WH ER and BH ER is significantly higher.
Figure 5
Figure 5
Evolutionary rates (ER) in the pol gene within- and between-hosts in 10 datasets. Within-host evolutionary rates are in red. The letters above the boxes indicate significant differences between datasets (t.test with a p-value <0.001). The dashed lines indicate the median ER of the WH data (in red) and of the BH data (in black) and these are significantly different (Welch two sample t-test, t = 17.3, df = 1418, p-val. < 0.001).

References

    1. Shankarappa R, Margolick JB, Gange SJ, Rodrigo AG, Upchurch D, Farzadegan H, Gupta P, Rinaldo CR, Learn GH, He X, Huang XL, Mullins JI. Consistent viral evolutionary changes associated with the progression of human immunodeficiency virus type 1 infection. J Virol. 1999;73(12):10489–10502. - PMC - PubMed
    1. Rambaut A, Posada D, Crandall KA, Holmes EC. The causes and consequences of HIV evolution. Nat Rev Genet. 2004;5:52–61. doi: 10.1038/nrg1246. - DOI - PubMed
    1. Levin BR, Bull JJ. Short-sighted evolution and the virulence of pathogenic microorganisms. Trends Microbiol. 1994;2(3):76–81. doi: 10.1016/0966-842X(94)90538-X. - DOI - PubMed
    1. Lemey P, Rambaut A, Pybus OG. HIV evolutionary dynamics within and among hosts. AIDS Rev. 2006;8(3):125–140. - PubMed
    1. Alizon S, Luciani F, Regoes RR. Epidemiological and clinical consequences of within-host evolution. Trends Microbiol. 2011;19:24–32. doi: 10.1016/j.tim.2010.09.005. - DOI - PubMed

Publication types