

Minimum-norm cortical source estimation in layered head models is robust against skull conductivity error
- PMID: 23639259
- PMCID: PMC3915841
- DOI: 10.1016/j.neuroimage.2013.04.086
Minimum-norm cortical source estimation in layered head models is robust against skull conductivity error
Abstract
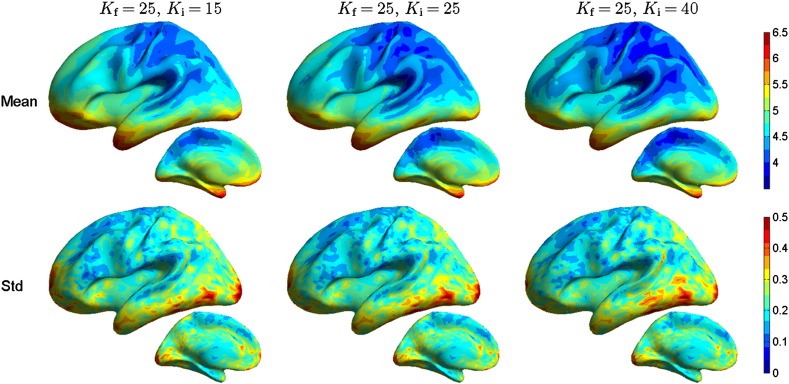
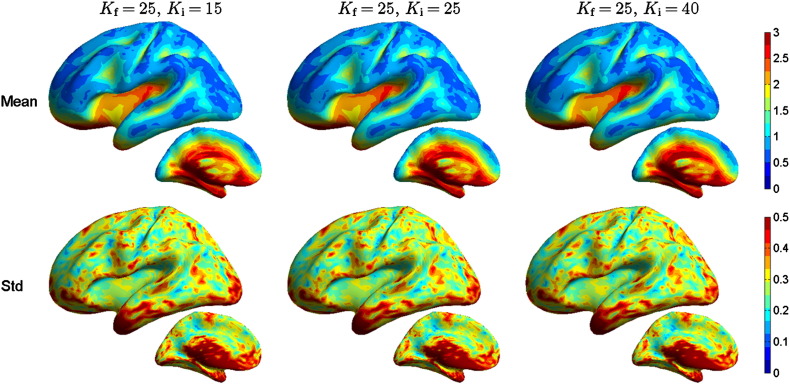
The conductivity profile of the head has a major effect on EEG signals, but unfortunately the conductivity for the most important compartment, skull, is only poorly known. In dipole modeling studies, errors in modeled skull conductivity have been considered to have a detrimental effect on EEG source estimation. However, as dipole models are very restrictive, those results cannot be generalized to other source estimation methods. In this work, we studied the sensitivity of EEG and combined MEG+EEG source estimation to errors in skull conductivity using a distributed source model and minimum-norm (MN) estimation. We used a MEG/EEG modeling set-up that reflected state-of-the-art practices of experimental research. Cortical surfaces were segmented and realistically-shaped three-layer anatomical head models were constructed, and forward models were built with Galerkin boundary element method while varying the skull conductivity. Lead-field topographies and MN spatial filter vectors were compared across conductivities, and the localization and spatial spread of the MN estimators were assessed using intuitive resolution metrics. The results showed that the MN estimator is robust against errors in skull conductivity: the conductivity had a moderate effect on amplitudes of lead fields and spatial filter vectors, but the effect on corresponding morphologies was small. The localization performance of the EEG or combined MEG+EEG MN estimator was only minimally affected by the conductivity error, while the spread of the estimate varied slightly. Thus, the uncertainty with respect to skull conductivity should not prevent researchers from applying minimum norm estimation to EEG or combined MEG+EEG data. Comparing our results to those obtained earlier with dipole models shows that general judgment on the performance of an imaging modality should not be based on analysis with one source estimation method only.
Keywords: Electroencephalography; Inverse problem; Magnetoencephalography; Minimum-norm estimation; Skull conductivity.
Copyright © 2013 The Authors. Published by Elsevier Inc. All rights reserved.
Figures


Similar articles
-
Linear inverse source estimate of combined EEG and MEG data related to voluntary movements.Hum Brain Mapp. 2001 Dec;14(4):197-209. doi: 10.1002/hbm.1052. Hum Brain Mapp. 2001. PMID: 11668651 Free PMC article.
-
Influence of tissue conductivity anisotropy on EEG/MEG field and return current computation in a realistic head model: a simulation and visualization study using high-resolution finite element modeling.Neuroimage. 2006 Apr 15;30(3):813-26. doi: 10.1016/j.neuroimage.2005.10.014. Epub 2005 Dec 20. Neuroimage. 2006. PMID: 16364662
-
Neonatal EEG at scalp is focal and implies high skull conductivity in realistic neonatal head models.Neuroimage. 2014 Aug 1;96:73-80. doi: 10.1016/j.neuroimage.2014.04.007. Epub 2014 Apr 13. Neuroimage. 2014. PMID: 24736169
-
Development of volume conductor and source models to localize epileptic foci.J Clin Neurophysiol. 2007 Apr;24(2):101-19. doi: 10.1097/WNP.0b013e318038fb3e. J Clin Neurophysiol. 2007. PMID: 17414966 Review.
-
Review on solving the forward problem in EEG source analysis.J Neuroeng Rehabil. 2007 Nov 30;4:46. doi: 10.1186/1743-0003-4-46. J Neuroeng Rehabil. 2007. PMID: 18053144 Free PMC article. Review.
Cited by
-
IFCN-endorsed practical guidelines for clinical magnetoencephalography (MEG).Clin Neurophysiol. 2018 Aug;129(8):1720-1747. doi: 10.1016/j.clinph.2018.03.042. Epub 2018 Apr 17. Clin Neurophysiol. 2018. PMID: 29724661 Free PMC article. Review.
-
Measuring MEG closer to the brain: Performance of on-scalp sensor arrays.Neuroimage. 2017 Feb 15;147:542-553. doi: 10.1016/j.neuroimage.2016.12.048. Epub 2016 Dec 19. Neuroimage. 2017. PMID: 28007515 Free PMC article.
-
Requirements for Coregistration Accuracy in On-Scalp MEG.Brain Topogr. 2018 Nov;31(6):931-948. doi: 10.1007/s10548-018-0656-5. Epub 2018 Jun 22. Brain Topogr. 2018. PMID: 29934728 Free PMC article.
-
Global sensitivity of EEG source analysis to tissue conductivity uncertainties.Front Hum Neurosci. 2024 Mar 12;18:1335212. doi: 10.3389/fnhum.2024.1335212. eCollection 2024. Front Hum Neurosci. 2024. PMID: 38532791 Free PMC article.
-
Quantitative spatio-temporal characterization of epileptic spikes using high density EEG: Differences between NREM sleep and REM sleep.Sci Rep. 2020 Feb 3;10(1):1673. doi: 10.1038/s41598-020-58612-4. Sci Rep. 2020. PMID: 32015406 Free PMC article.
References
-
- Akhtari M., Bryant H.C., Mamelak A.N., Flynn E.R., Heller L., Shih J.J., Mandelkern M., Matlachov A., Ranken D.M., Best E.D., DiMauro M.A., Lee R.R., Sutherling W.W. Conductivities of three-layer live human skull. Brain Topogr. 2002;14(3):151–167. - PubMed
-
- Baillet S., Mosher J.C., Leahy R.M. Electromagnetic brain mapping. IEEE Signal Proc. Mag. 2001;18(6):14–30.
-
- Chen F.M., Hallez H., Staelens S. Influence of skull conductivity perturbations on EEG dipole source analysis. Med. Phys. 2010;37(8):4475–4484. - PubMed
-
- Crevecoeur G., Restrepo V.M., Staelens S. Subspace electrode selection methodology for the reduction of the effect of uncertain conductivity values in the EEG dipole localization: a simulation study using a patient-specific head model. Phys. Med. Biol. 2012;57(7):1963–1986. - PubMed
-
- Dale A.M., Sereno M.I. Improved localization of cortical activity by combining EEG and MEG with MRI cortical surface reconstruction — a linear approach. J. Cogn. Neurosci. 1993;5(2):162–176. - PubMed
MeSH terms
Grants and funding
LinkOut - more resources
Full Text Sources
Other Literature Sources
