

Motion artifacts in functional near-infrared spectroscopy: a comparison of motion correction techniques applied to real cognitive data
- PMID: 23639260
- PMCID: PMC3762942
- DOI: 10.1016/j.neuroimage.2013.04.082
Motion artifacts in functional near-infrared spectroscopy: a comparison of motion correction techniques applied to real cognitive data
Abstract
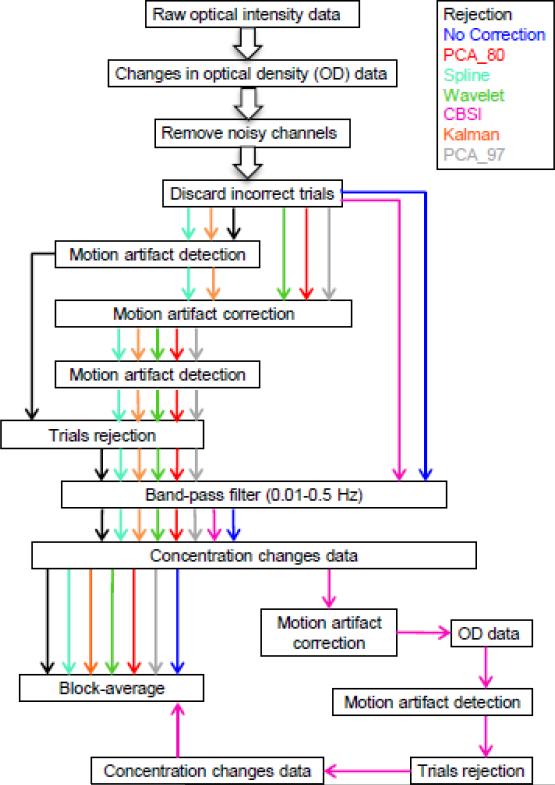
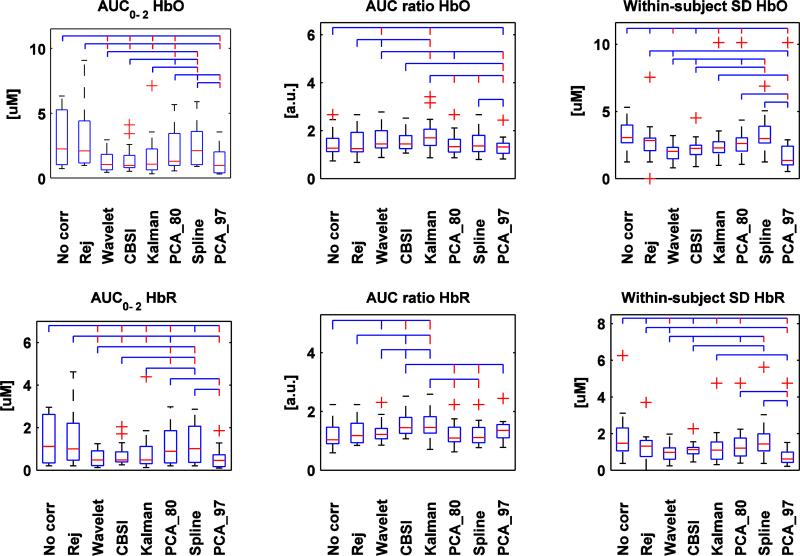
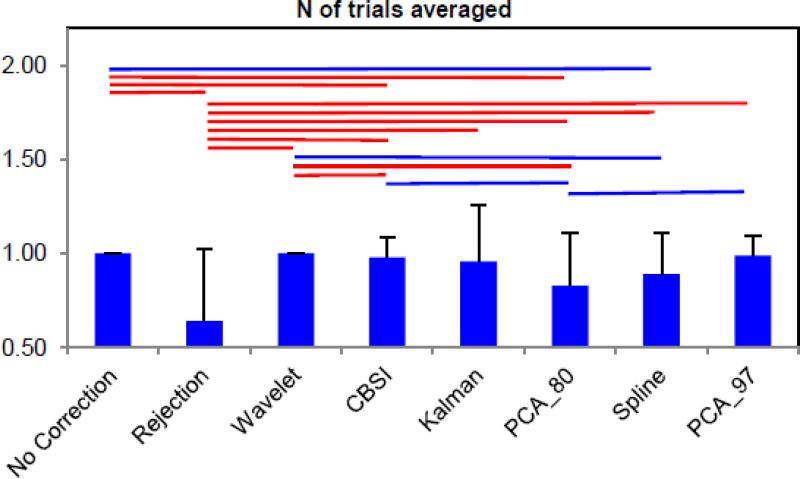
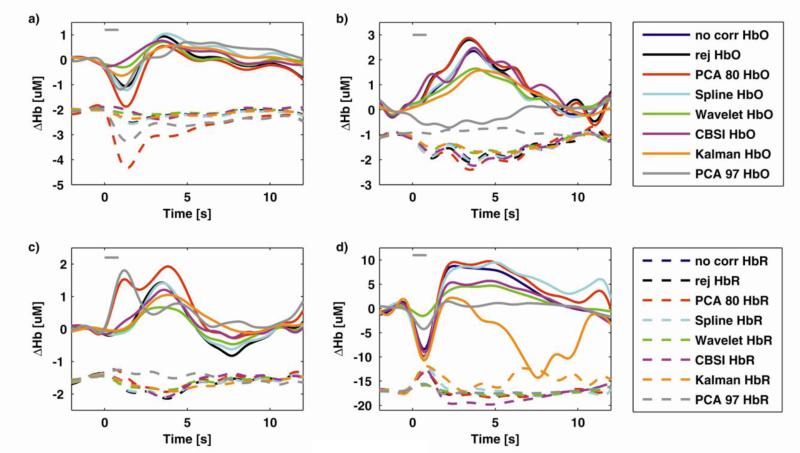
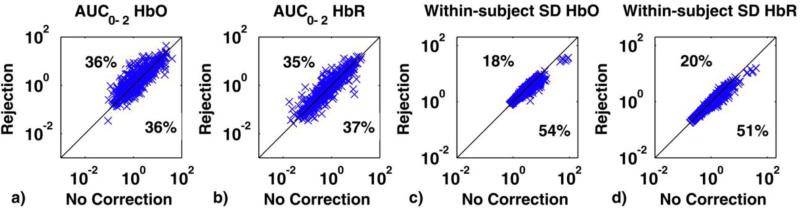
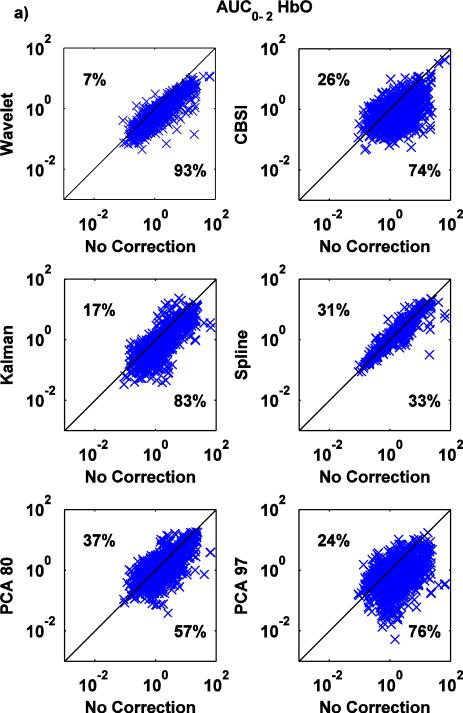
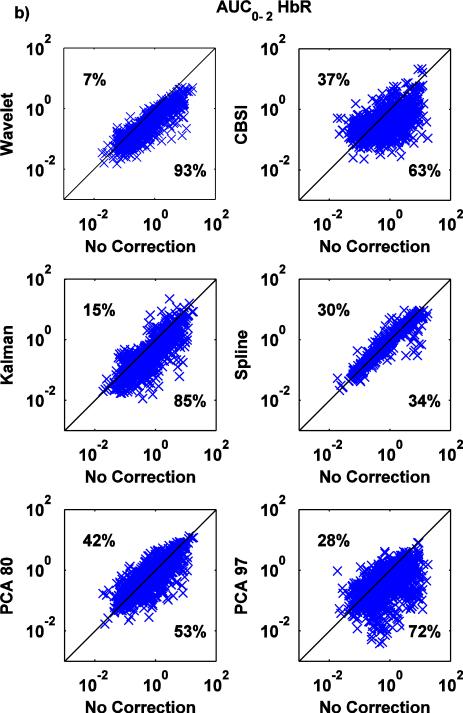
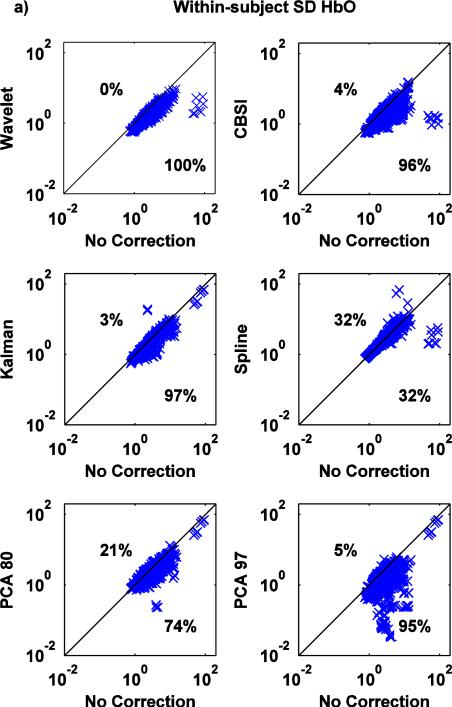
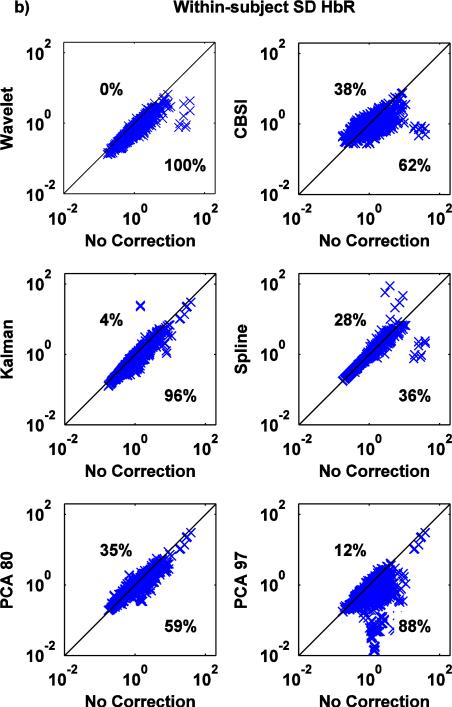
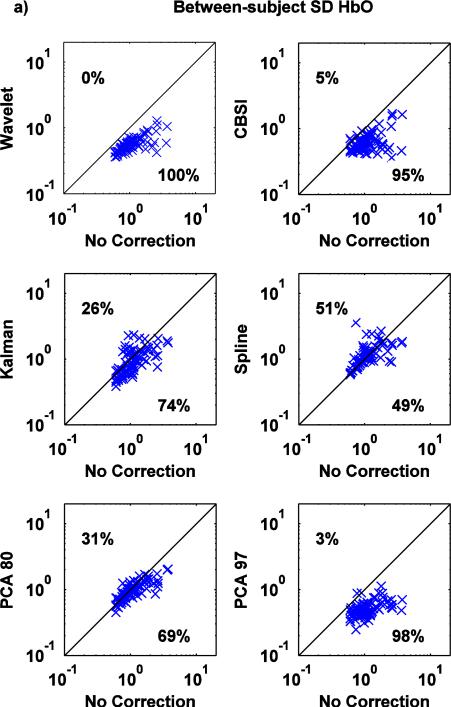
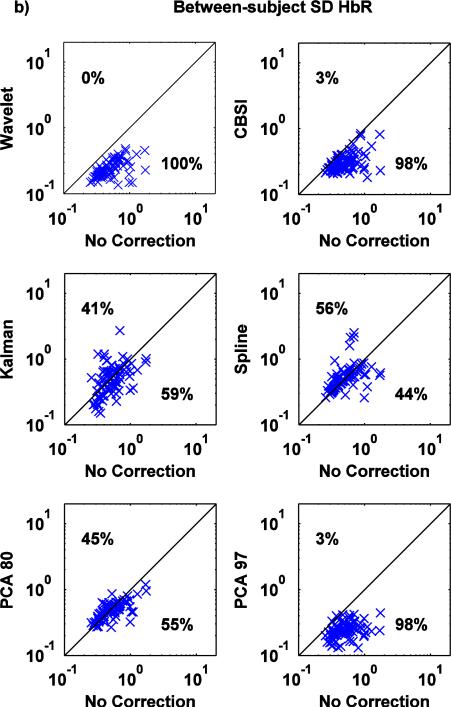
Motion artifacts are a significant source of noise in many functional near-infrared spectroscopy (fNIRS) experiments. Despite this, there is no well-established method for their removal. Instead, functional trials of fNIRS data containing a motion artifact are often rejected completely. However, in most experimental circumstances the number of trials is limited, and multiple motion artifacts are common, particularly in challenging populations. Many methods have been proposed recently to correct for motion artifacts, including principle component analysis, spline interpolation, Kalman filtering, wavelet filtering and correlation-based signal improvement. The performance of different techniques has been often compared in simulations, but only rarely has it been assessed on real functional data. Here, we compare the performance of these motion correction techniques on real functional data acquired during a cognitive task, which required the participant to speak aloud, leading to a low-frequency, low-amplitude motion artifact that is correlated with the hemodynamic response. To compare the efficacy of these methods, objective metrics related to the physiology of the hemodynamic response have been derived. Our results show that it is always better to correct for motion artifacts than reject trials, and that wavelet filtering is the most effective approach to correcting this type of artifact, reducing the area under the curve where the artifact is present in 93% of the cases. Our results therefore support previous studies that have shown wavelet filtering to be the most promising and powerful technique for the correction of motion artifacts in fNIRS data. The analyses performed here can serve as a guide for others to objectively test the impact of different motion correction algorithms and therefore select the most appropriate for the analysis of their own fNIRS experiment.
Keywords: Functional near-infrared spectroscopy; Hemodynamic response; Motion artifact; Motion correction; fNIRS.
Copyright © 2013 Elsevier Inc. All rights reserved.
Figures

Similar articles
-
A kurtosis-based wavelet algorithm for motion artifact correction of fNIRS data.Neuroimage. 2015 May 15;112:128-137. doi: 10.1016/j.neuroimage.2015.02.057. Epub 2015 Mar 4. Neuroimage. 2015. PMID: 25747916 Free PMC article.
-
Comparison of motion correction techniques applied to functional near-infrared spectroscopy data from children.J Biomed Opt. 2015;20(12):126003. doi: 10.1117/1.JBO.20.12.126003. J Biomed Opt. 2015. PMID: 26662300 Free PMC article.
-
Recommendations for motion correction of infant fNIRS data applicable to multiple data sets and acquisition systems.Neuroimage. 2019 Oct 15;200:511-527. doi: 10.1016/j.neuroimage.2019.06.056. Epub 2019 Jun 25. Neuroimage. 2019. PMID: 31247300
-
Statistical analysis of fNIRS data: a comprehensive review.Neuroimage. 2014 Jan 15;85 Pt 1:72-91. doi: 10.1016/j.neuroimage.2013.06.016. Epub 2013 Jun 15. Neuroimage. 2014. PMID: 23774396 Review.
-
The promise of functional near-infrared spectroscopy in autism research: What do we know and where do we go?Soc Neurosci. 2019 Oct;14(5):505-518. doi: 10.1080/17470919.2018.1497701. Epub 2018 Jul 21. Soc Neurosci. 2019. PMID: 29985114 Review.
Cited by
-
A synchrony-dependent influence of sounds on activity in visual cortex measured using functional near-infrared spectroscopy (fNIRS).PLoS One. 2015 Mar 31;10(3):e0122862. doi: 10.1371/journal.pone.0122862. eCollection 2015. PLoS One. 2015. PMID: 25826284 Free PMC article.
-
A wide field-of-view, modular, high-density diffuse optical tomography system for minimally constrained three-dimensional functional neuroimaging.Biomed Opt Express. 2020 Jul 9;11(8):4110-4129. doi: 10.1364/BOE.394914. eCollection 2020 Aug 1. Biomed Opt Express. 2020. PMID: 32923032 Free PMC article.
-
Methodology for high-yield acquisition of functional near-infrared spectroscopy data from alert, upright infants.Neurophotonics. 2016 Jul;3(3):031415. doi: 10.1117/1.NPh.3.3.031415. Epub 2016 Jul 28. Neurophotonics. 2016. PMID: 27493980 Free PMC article.
-
Validating a new methodology for optical probe design and image registration in fNIRS studies.Neuroimage. 2015 Feb 1;106:86-100. doi: 10.1016/j.neuroimage.2014.11.022. Neuroimage. 2015. PMID: 25705757 Free PMC article.
-
On Your Mark, Get Set, Self-Control, Go: A Differentiated View on the Cortical Hemodynamics of Self-Control during Sprint Start.Brain Sci. 2020 Jul 29;10(8):494. doi: 10.3390/brainsci10080494. Brain Sci. 2020. PMID: 32751179 Free PMC article.
References
-
- Boas DA, Franceschini MA, Dunn AK, Strangman G. Noninvasive Imaging of Cerebral Activation with Diffuse Optical Tomography. In: Frostig RD, editor. In Vivo Optical Imaging of Brain Function. CRC Press; 2002. pp. 193–221. - PubMed
-
- Brigadoi S, Cutini S, Scarpa F, Scatturin P, Dell'Acqua R. Exploring the role of primary and supplementary motor areas in simple motor tasks with fNIRS. Cogn. Process. 2012;13(Suppl. 1):S97–101. - PubMed
-
- Cope M, Delpy DT. System for long-term measurement of cerebral blood and tissue oxygenation on newborn infants by near infra-red transillumination. Med. Biol. Eng. Comput. 1988;26(3):289–294. - PubMed
Publication types
MeSH terms
Substances
Grants and funding
LinkOut - more resources
Full Text Sources
Other Literature Sources
