

Dominant frequencies of resting human brain activity as measured by the electrocorticogram
- PMID: 23639261
- PMCID: PMC4269223
- DOI: 10.1016/j.neuroimage.2013.04.044
Dominant frequencies of resting human brain activity as measured by the electrocorticogram
Abstract
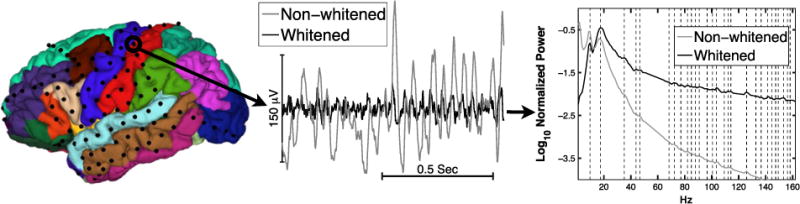
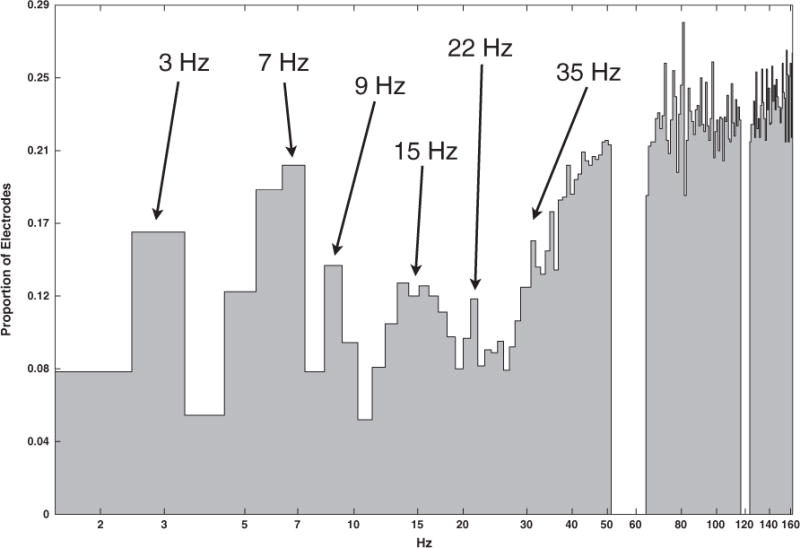
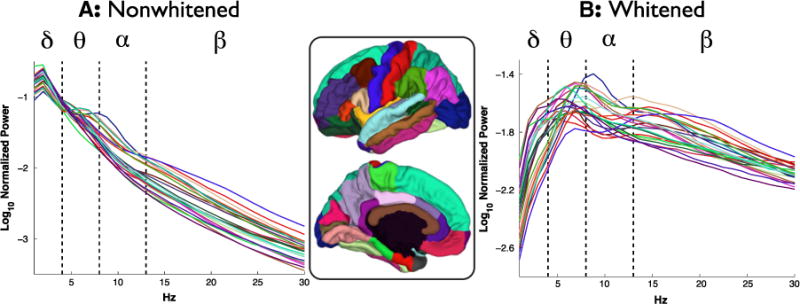
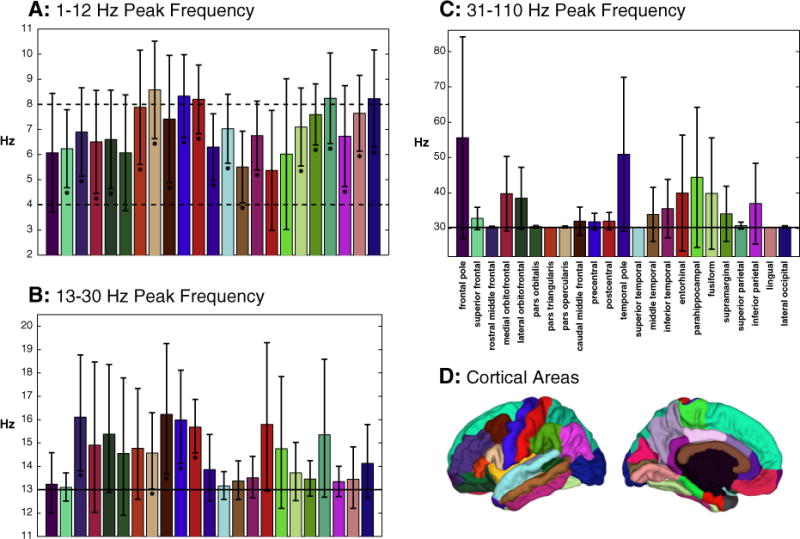
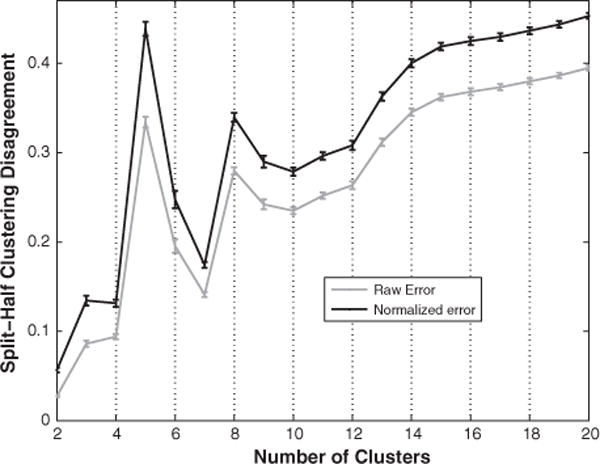
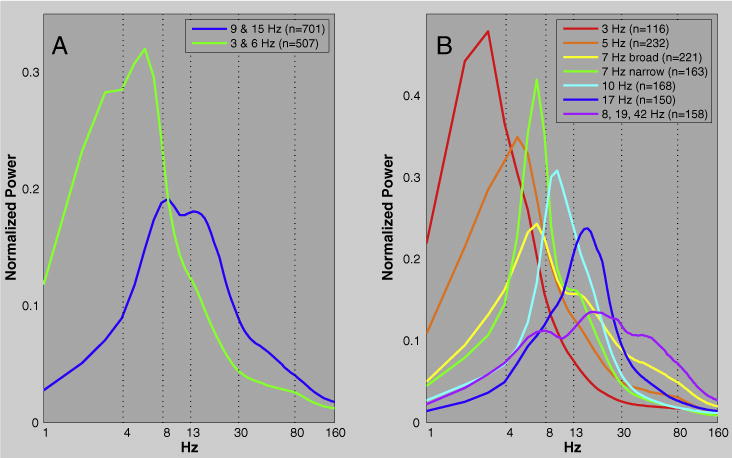
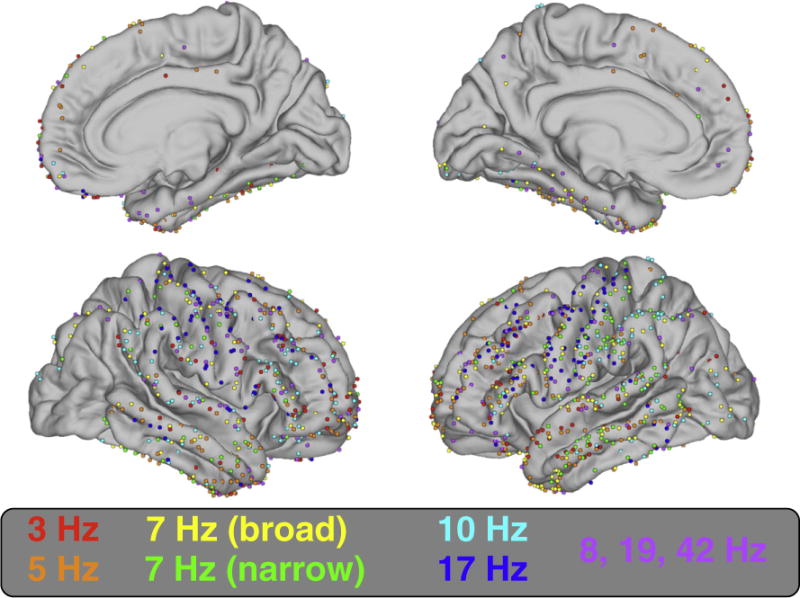
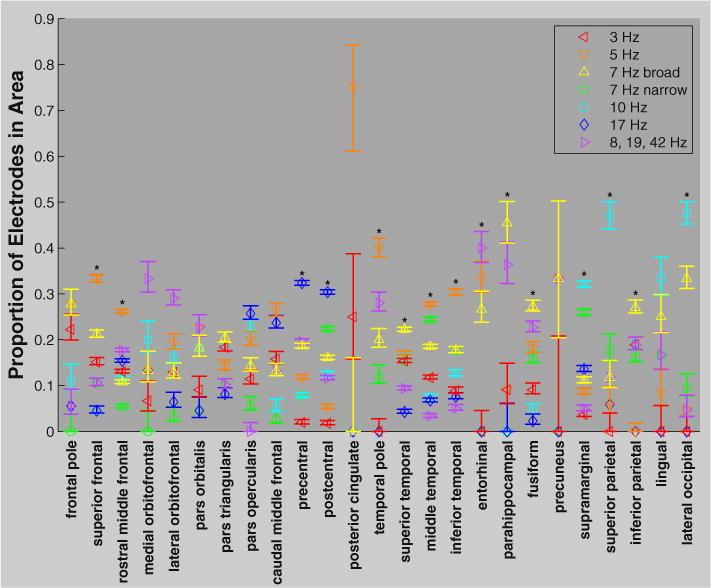
The brain's spontaneous, intrinsic activity is increasingly being shown to reveal brain function, delineate large scale brain networks, and diagnose brain disorders. One of the most studied and clinically utilized types of intrinsic brain activity are oscillations in the electrocorticogram (ECoG), a relatively localized measure of cortical synaptic activity. Here we objectively characterize the types of ECoG oscillations commonly observed over particular cortical areas when an individual is awake and immobile with eyes closed, using a surface-based cortical atlas and cluster analysis. Both methods show that [1] there is generally substantial variability in the dominant frequencies of cortical regions and substantial overlap in dominant frequencies across the areas sampled (primarily lateral central, temporal, and frontal areas), [2] theta (4-8 Hz) is the most dominant type of oscillation in the areas sampled with a mode around 7 Hz, [3] alpha (8-13 Hz) is largely limited to parietal and occipital regions, and [4] beta (13-30 Hz) is prominent peri-Rolandically, over the middle frontal gyrus, and the pars opercularis. In addition, the cluster analysis revealed seven types of ECoG spectral power densities (SPDs). Six of these have peaks at 3, 5, 7 (narrow), 7 (broad), 10, and 17 Hz, while the remaining cluster is broadly distributed with less pronounced peaks at 8, 19, and 42 Hz. These categories largely corroborate conventional sub-gamma frequency band distinctions (delta, theta, alpha, and beta) and suggest multiple sub-types of theta. Finally, we note that gamma/high gamma activity (30+ Hz) was at times prominently observed, but was too infrequent and variable across individuals to be reliably characterized. These results should help identify abnormal patterns of ECoG oscillations, inform the interpretation of EEG/MEG intrinsic activity, and provide insight into the functions of these different oscillations and the networks that produce them. Specifically, our results support theories of the importance of theta oscillations in general cortical function, suggest that alpha activity is primarily related to sensory processing/attention, and demonstrate that beta networks extend far beyond primary sensorimotor regions.
Copyright © 2013 Elsevier Inc. All rights reserved.
Conflict of interest statement
The authors declare no conflicts of interest.
Figures
References
-
- Benjamini Y, Hochberg Y. Controlling the false discovery rate: a practical and powerful approach to multiple testing. J R Stat Soc Ser B Methodol. 1995;57:289–300.
-
- Bibbig A, Traub RD, Whittington MA. Long-range synchronization of γ and β oscillations and the plasticity of excitatory and inhibitory synapses: a network model. J Neurophysiol. 2002;88:1634–1654. - PubMed
-
- Biswal BB, Mennes M, Zuo XN, Gohel S, Kelly C, Smith SM, Beckmann CF, Adelstein JS, Buckner RL, Colcombe S, Dogonowski AM, Ernst M, Fair D, Hampson M, Hoptman MJ, Hyde JS, Kiviniemi VJ, Kotter R, Li SJ, Lin CP, Lowe MJ, Mackay C, Madden DJ, Madsen KH, Margulies DS, Mayberg HS, McMahon K, Monk CS, Mostofsky SH, Nagel BJ, Pekar JJ, Peltier SJ, Petersen SE, Riedl V, Rombouts SARB, Rypma B, Schlaggar BL, Schmidt S, Seidler RD, Siegle GJ, Sorg C, Teng GJ, Veijola J, Villringer A, Walter M, Wang L, Weng XC, Whitfield-Gabrieli S, Williamson P, Windischberger C, Zang YF, Zhang HY, Castellanos FX, Milham MP. Toward discovery science of human brain function. Proc Natl Acad Sci. 2010;107:4734–4739. - PMC - PubMed
-
- Blume WT. Drug effects on EEG. J Clin Neurophysiol. 2006;23:306. - PubMed
Publication types
MeSH terms
Grants and funding
LinkOut - more resources
Full Text Sources
Other Literature Sources
Miscellaneous
