. 2013 Apr 29;25(2):156-68.
doi: 10.1016/j.devcel.2013.03.019.

The neuropilin 1 cytoplasmic domain is required for VEGF-A-dependent arteriogenesis

Affiliations

The neuropilin 1 cytoplasmic domain is required for VEGF-A-dependent arteriogenesis

Anthony Lanahan et al. Dev Cell. .

Abstract

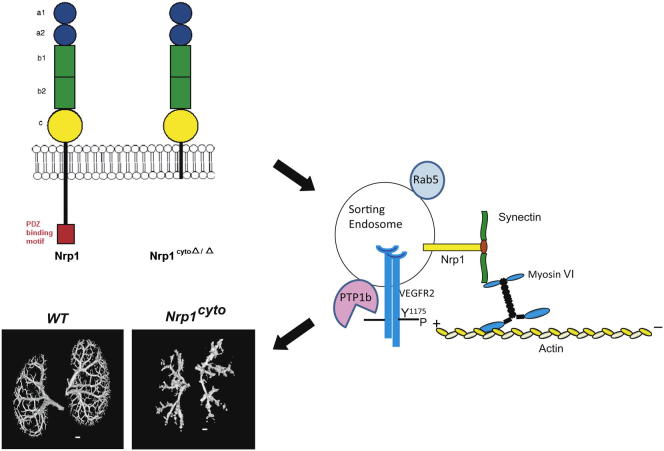
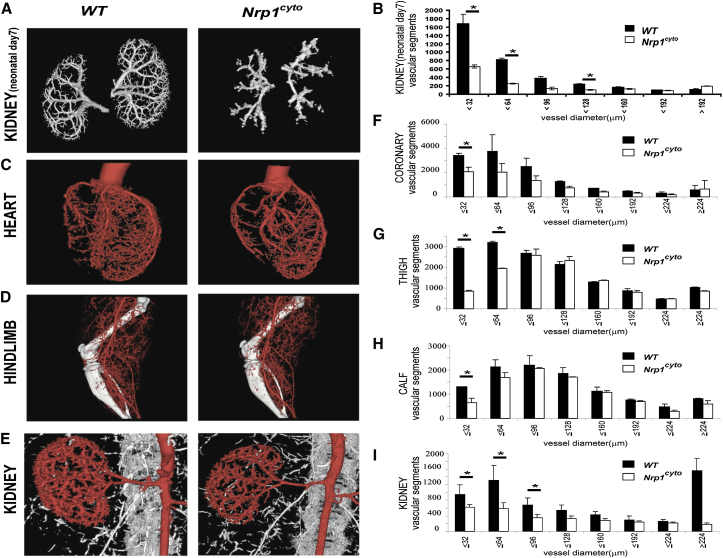
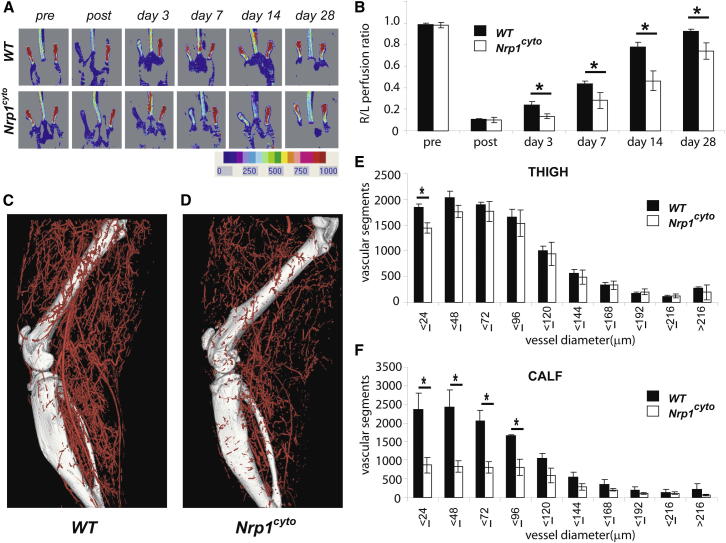
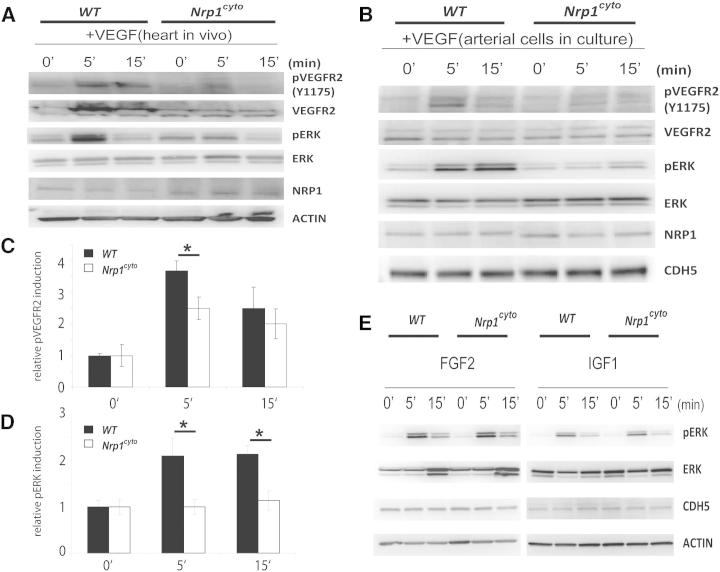
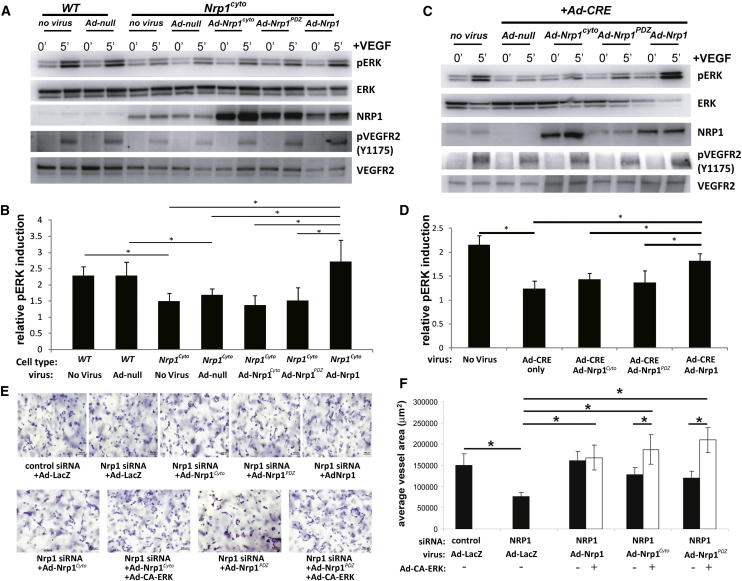
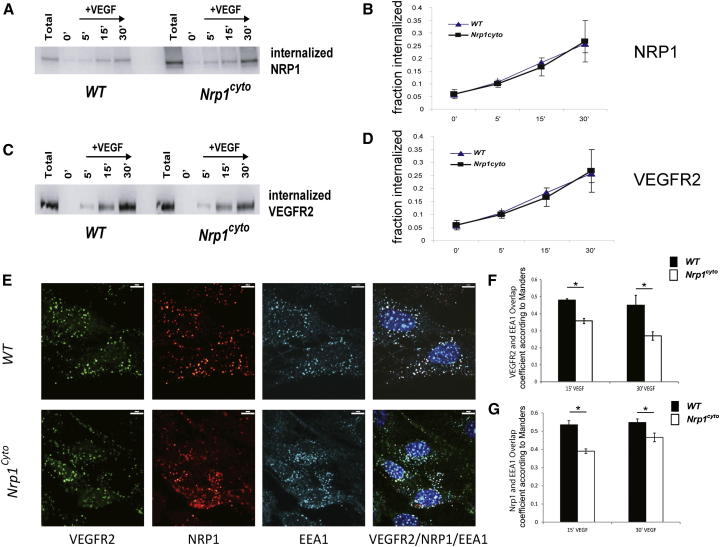
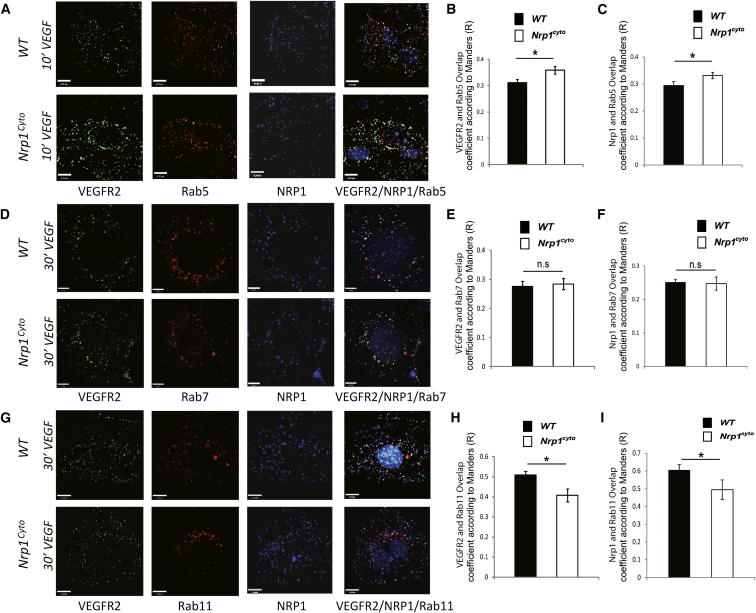
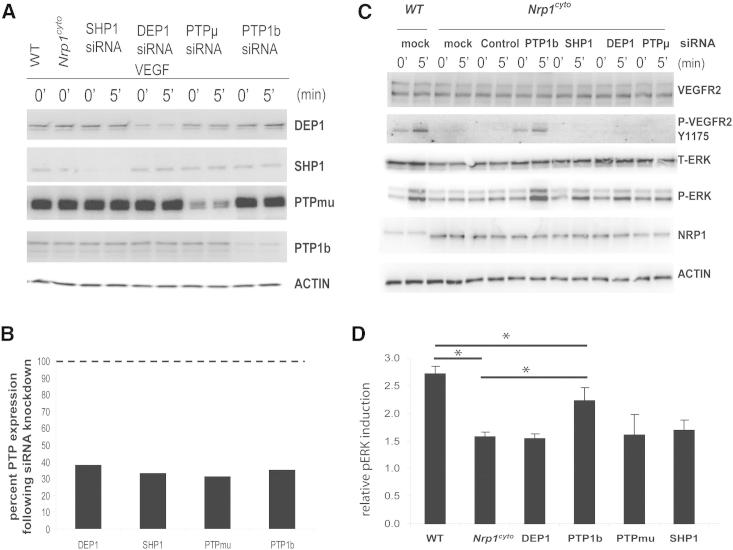
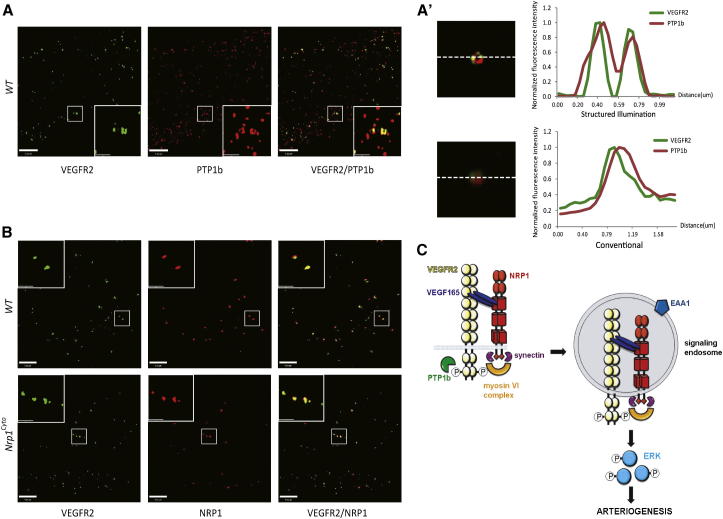
Neuropilin 1 (NRP1) plays an important but ill-defined role in VEGF-A signaling and vascular morphogenesis. We show that mice with a knockin mutation that ablates the NRP1 cytoplasmic tail (Nrp1(cyto)) have normal angiogenesis but impaired developmental and adult arteriogenesis. The arteriogenic defect was traced to the absence of a PDZ-dependent interaction between NRP1 and VEGF receptor 2 (VEGFR2) complex and synectin, which delayed trafficking of endocytosed VEGFR2 from Rab5+ to EAA1+ endosomes. This led to increased PTPN1 (PTP1b)-mediated dephosphorylation of VEGFR2 at Y(1175), the site involved in activating ERK signaling. The Nrp1(cyto) mutation also impaired endothelial tubulogenesis in vitro, which could be rescued by expressing full-length NRP1 or constitutively active ERK. These results demonstrate that the NRP1 cytoplasmic domain promotes VEGFR2 trafficking in a PDZ-dependent manner to regulate arteriogenic ERK signaling and establish a role for NRP1 in VEGF-A signaling during vascular morphogenesis.


Figures

None
Graphical abstract
Figure 1
Figure 1
Micro-CT Analysis of the Arterial Vasculature Kidney of Neonatal Day 7 Kidney and in Heart, Hindlimb, and Kidney of Adult Nrp1cyto Mice and Wild-Type Littermates (A–D) Representative reconstructed micro-CT images of day 7 neonatal kidney and the heart, hindlimb, and kidney of WT and Nrp1cyto mice at 16 μm resolution. (E–I) Quantitative analysis of micro-CT images from Nrp1cyto (white bars) and WT (black bars) neonatal kidney and adult heart, hindlimb, and kidney shows a significant decrease in the total number of <100 μm diameter vessels (mean ± SEM, *p < 0.05). See also Figures S1 and S2.
Figure 2
Figure 2
Nrp1cyto Mice Show Impaired Blood Flow Recovery in the Hindlimb Ischemia Model (A and B) Blood flow measurements in the HLI model. (A) Doppler imaging demonstrated the level of perfusion in hindlimbs of WT and Nrp1cyto mice before and after HLI surgery at the indicated time points. (B) Quantitative analysis of laser Doppler images 3 days after HLI surgery in WT (black bars) and in Nrp1cyto mice (mean ± SEM, *p < 0.05). (C–F) Micro-CT analysis of arterial diameter in the HLI model. Representative micro-CT images of (C) WT and (D) Nrp1cyto mice 14 days after HLI surgery. Quantitative micro-CT analysis of arterial vasculature (E) above and (F) below the knee in WT (black bars) and Nrp1cyto mice (white bars) 14 days after HLI surgery. The total number of <100 μm diameter vessels was significantly decreased in Nrp1cyto mice relative to WT littermates in both the thigh and calf (mean ± SEM, *p < 0.05). See also Figure S3.
Figure 3
Figure 3
Impaired VEGF-A Signaling in Nrp1cyto Mice (A) Western blot analysis of heart lysates following intraperitoneal injection of VEGF-A. Blots show reduced ERK and VEGFR2 phosphorylation in Nrp1cyto mice relative to WT littermates. (B–D) Western blot analysis of cell lysates from primary arterial EC from Nrp1cyto and WT EC that were serum-starved and then stimulated for the indicated times with 50 ng/ml VEGF-A165. (B) Blots show reduced phosphorylation of VEGFR2 on Y1175 and of ERK in Nrp1cyto relative to control EC. (C) Quantification of the ratio of phospho-VEGFR2 (pVEGFR2) relative to total VEGFR2 (VEGFR2) (mean ± SD, n = 5, *p < 0.05). (D) Quantification of the ratio of phospho-ERK (pERK) relative to total ERK (ERK) (mean ± SD, n = 5, *p < 0.05). (E) Western blot analysis of cell lysates from Nrp1cyto and WT primary arterial EC that were serum-starved and stimulated for the indicated times with 50 ng/ml of FGF2 or IGF1. ERK phosphorylation was similar in Nrp1cyto and WT EC. See also Figure S4.
Figure 4
Figure 4
Rescue of VEGF-A Signaling in Nrp1cyto and Nrp1fl/fl Primary EC by Full-Length NRP1 and of EC Tubulogenesis following NRP1 siRNA Knockdown with Constitutively Active ERK (A and B) Western blot analysis of Nrp1cyto EC that were transduced with the indicated adenoviral constructs, serum-starved and stimulated with 50 ng/ml VEGF-A165. Blots (A) and quantitation of ERK activation (B) show that Ad-Nrp1, but not Ad-Nrp1cyto or Ad-Nrp1PDZ, restores VEGF-A-induced VEGFR2 and ERK activation in Nrp1cyto EC (mean ± SD, n = 3, *p < 0.05). (C and D) Western blot analysis of Nrp1fl/fl EC treated with adenoviral constructs expressing CRE recombinase to inactivate NRP1 were transduced with the indicated adenoviral constructs, serum-starved and stimulated with 50 ng/ml VEGF-A165. Blots (C) and quantitation (D) show that Ad-Nrp1, but not Ad-Nrp1cyto or Ad-Nrp1PDZ, restores the activation of VEGFR2 and ERK (mean ± SD, n = 3, *p < 0.05). (E and F) HUVEC treated with control or NRP1 siRNA were treated with the indicated adenoviral vectors to compare their capacity to undergo tube formation in 3D collagen matrices after 72 hr. Representative images (E) and quantification (F) of tubulogenesis after 72 hr (mean ± SEM, n = 18, *p < 0.05). Scale bar represents 100 um.
Figure 5
Figure 5
Normal Internalization but Reduced Colocalization of VEGFR2 and NRP1 in EAA1+ Endosomes in Nrp1cyto Arterial EC (A–D) Western blot analysis of NRP1 and VEGFR2 internalization following cell surface biotinylation and VEGF-A165 stimulation in WT and Nrp1cyto EC. (A and B) Blots show internalization at the indicated times. (C and D) Quantification of NRP1 and VEGFR2 internalization at 5, 15, and 30 min following VEGF-A165 stimulation relative to time 0 (mean ± SEM, n = 4). (E–G) VEGFR2 and NRP1 colocalization in EAA1+ endosomes in primary arterial EC from WT and Nrp1cyto mice after VEGF-A165 stimulation. (E) Confocal images of EC that were immunolabeled for VEGFR2, NRP1, and EEA1 15 min after stimulation. Scale bar represents 9 μm. Quantification of VEGFR2 (F) and NRP1 (G) colocalization in EEA1-positive vesicles 15 and 30 min after VEGF-A165 stimulation shows a significant reduction in the number of EEA1 endosomes containing VEGFR2 in Nrp1cyto relative to WT EC (overlap coefficient according to Manders, n = 10 independent fields for each time point and cell type, mean ± SEM, *p < 0.05). See also Figure S5.
Figure 6
Figure 6
Impaired VEGFR2 and NRP1 Trafficking in Nrp1cyto Arterial EC (A–C) Primary arterial EC from WT and Nrp1cyto mice were immunolabeled for VEGFR2, NRP1, and Rab5 10 min after VEGF-A165 stimulation. Confocal images (A) (scale bar represents 9 μm) and quantification (B) and (C). The overlap coefficient according to Manders shows that the number of Rab5+ endosomes containing VEGFR2 and NRP1 is significantly increased in Nrp1cyto relative to WT EC (n = 10 independent fields for each time point and cell type, mean ± SEM, *p < 0.05). (D–F) Primary arterial EC from WT and Nrp1cyto mice were immunolabeled for VEGFR2, NRP1, and Rab7 30 min after VEGF-A165 stimulation. Confocal images (D) (scale bar represents 7 μm) and quantification (E) and (F). The overlap coefficient according to Manders shows that the number of Rab7+ endosomes containing VEGFR2 and NRP1 is not changed in Nrp1cyto relative to WT EC, even though both proteins accumulate in the upstream Rab5+ compartment in Nrp1cyto EC (n = 10 independent fields for each time point and cell type, mean ± SEM). (G–I) Primary arterial EC from WT and Nrp1cyto mice were immunolabeled for VEGFR2, NRP1, and Rab11 30 min after VEGF-A165 stimulation. Confocal images (G) (scale bar represents 12 μm) and quantification (H) and (I). The overlap coefficient according to Manders shows that the number of Rab11+ endosomes containing VEGFR2 and NRP1 is significantly decreased in Nrp1cyto relative to WT EC, as expected, because both proteins accumulate in the upstream Rab5+ compartment in Nrp1cyto EC (n = 10 independent fields for each time point and cell type, mean ± SEM, *p < 0.05). See also Figures S6 and S7.
Figure 7
Figure 7
Rescue of Defective ERK Signaling in VEGF-A-Stimulated Nrp1cyto Arterial EC by Knockdown of PTP1b Primary arterial EC from Nrp1cyto mice transfected with siRNA specific for the indicated phosphatases were serum-starved and then stimulated with 50 ng/ml VEGF-A165. (A and B) Knockdown of the indicated phosphatases in Nrp1cyto arterial EC shown by immunoblotting (A); PTP1b knockdown was quantified in (B), dashed line indicates normal expression levels. (C and D) ERK and VEGFR2 (Y1175) phosphorylation after knockdown of the indicated phosphatases shown by immunoblotting (C). Quantification of pERK activation is shown in (D) (n = 3, mean ± SD, *p < 0.05).
Figure 8
Figure 8
Colocalization of PTP1B, VEGFR2, and NRP1 by SIM Confocal Microscopy and Model of NRP1-Dependent Arteriogenic Signaling (A) SIM images of primary arterial EC immunolabeled for VEGFR2 and PTP1b 10 min after VEGF-A165 stimulation show colocalization of VEGFR2 and PTP1b in “donut”-shaped structures characteristic of early endosomes. (A′) The top panel shows an endocytic vesicle imaged using structured illumination microscopy and the adjacent graph plots localization of VEGFR2 and PTP1b in the vesicle. Note the colocalization of VEGFR2 and PTP1b in the donut-shaped structure characteristic of early endosomes. The bottom panel shows the same endocytic vesicle in (A), but imaged using conventional microscopy, and the adjacent graph plots localization of VEGFR2 and PTP1b in the vesicle; note the superior resolution of SIM. Scale bar represents 20 μm. (B) SIM images of primary arterial EC form WT and Nrp1cyto mice immunolabeled for VEGFR2 and NRP1 15 min after VEGF-A165 stimulation show colocalization of VEGFR2 and NRP1 in both cell types. (C) Model of NRP1-dependent arteriogenic signaling. VEGF-A165 binding to VEGFR2 and NRP1 on the plasma membrane induces complex formation between the three molecules and leads to clathrin-mediated endocytosis. Phosphorylation of Y1175 in VEGFR2 stimulates ERK signaling, but is inactivated when exposed to the tyrosine phosphatase PTP1b at the plasma membrane or in RAB5+ endosomes. The NRP1 cytoplasmic domain links the VEGF-A165/VEGFR2/NRP1 complex to myosin VI via synectin to promote trafficking from RAB5+ to EAA1+ endosomes, where VEGFR2 maintains its Y1175 phosphorylation in the absence of exposure to PTP1b and is therefore able to evoke ERK signaling of sufficient amplitude to promote arteriogenesis. See also Figure S8.

References

    1. Ballmer-Hofer K., Andersson A.E., Ratcliffe L.E., Berger P. Neuropilin-1 promotes VEGFR-2 trafficking through Rab11 vesicles thereby specifying signal output. Blood. 2011;118:816–826. - PubMed
    1. Booth R.A., Cummings C., Tiberi M., Liu X.J. GIPC participates in G protein signaling downstream of insulin-like growth factor 1 receptor. J. Biol. Chem. 2002;277:6719–6725. - PubMed
    1. Cai H., Reed R.R. Cloning and characterization of neuropilin-1-interacting protein: a PSD-95/Dlg/ZO-1 domain-containing protein that interacts with the cytoplasmic domain of neuropilin-1. J. Neurosci. 1999;19:6519–6527. - PMC - PubMed
    1. Carmeliet P., Jain R.K. Molecular mechanisms and clinical applications of angiogenesis. Nature. 2011;473:298–307. - PMC - PubMed
    1. Chittenden T.W., Claes F., Lanahan A.A., Autiero M., Palac R.T., Tkachenko E.V., Elfenbein A., Ruiz de Almodovar C., Dedkov E., Tomanek R. Selective regulation of arterial branching morphogenesis by synectin. Dev. Cell. 2006;10:783–795. - PubMed

Publication types

MeSH terms

Substances