

In vivo magnetic resonance imaging of mice liver tumors using a new gadolinium-based contrast agent
- PMID: 23639510
- PMCID: PMC11916545
- DOI: 10.1016/j.kjms.2012.09.002
In vivo magnetic resonance imaging of mice liver tumors using a new gadolinium-based contrast agent
Abstract
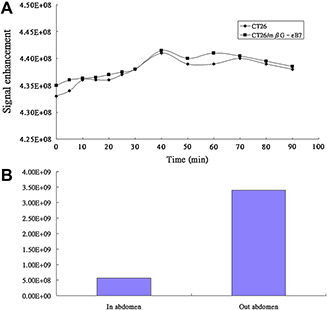
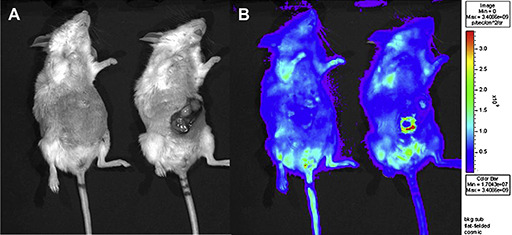
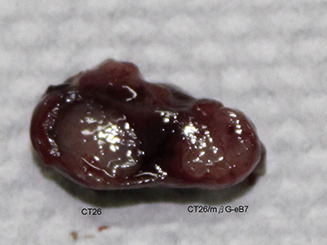
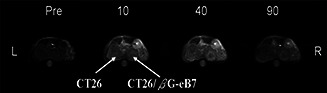
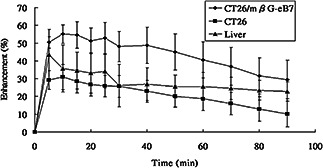
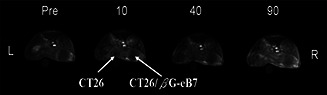
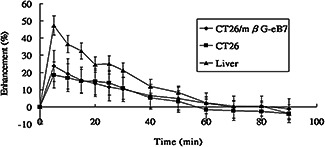
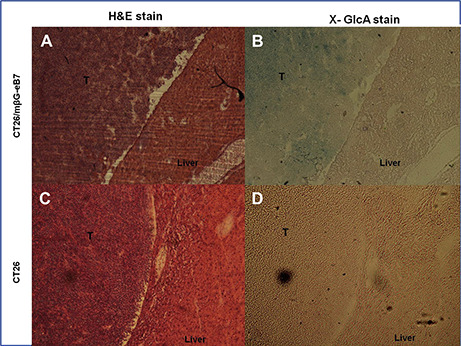
We compared the enhancement effect between a newly synthesized tissue-specific contrast agent, [Gd-DOTA-FPβG], and a commercially available agent, [Gd(DOTA)](-), in a murine model of liver tumor using a clinical magnetic resonance imaging scanner. The colon cancer cell lines with and without β-glucuronidase (βG) expression were implanted into the liver of mice. Self-synthesized gadolinium-based magnetic resonance contrast agent, [Gd(DOTA-FPβG)], was administered to measure enhancement on magnetic resonance images using a commercially available agent, [Gd(DOTA)](-), as control in a clinical 3.0 tesla (T) magnetic resonance scanner. In vivo fluorescence imaging and histopathology of the liver were also performed to compare and correlate with the magnetic resonance studies. The in vivo fluorescence imaging failed to depict a sufficiently intense signal for liver or liver tumor of mice without exposure of the liver following an incision on the abdominal wall. The tissue-specific magnetic resonance agent, [Gd(DOTA-FPβG)], caused significantly stronger enhancement in tumors expressing βG (CT26/mβG-eB7) than in tumors not expressing βG (CT26) (p < 0.05). In the magnetic resonance imaging studies using control agent [Gd(DOTA)](-), the tumors with and without βG expression depicted no significant difference in enhancement on the T1-weighted images. The [Gd(DOTA-FPβG)] also provided significantly more contrast uptake in the CT26/mβG-eB7 tumor than in the normal liver parenchyma, whereas the [Gd(DOTA)](-) did not. This study confirms that better contrast enhancement can be readily detected in vivo by the use of a tissue-specific magnetic resonance contrast agent to target tumor cells with specific biomarkers in a clinical magnetic resonance imaging scanner.
Copyright © 2012. Published by Elsevier B.V.
Figures
Similar articles
-
Evaluation of gadolinium 2,5-BPA-DO3A, a new macrocyclic hepatobiliary chelate, in normal liver and metastatic disease on high field magnetic resonance imaging.Invest Radiol. 1996 Jan;31(1):11-6. doi: 10.1097/00004424-199601000-00003. Invest Radiol. 1996. PMID: 8850360
-
Tumor Contrast Enhancement and Whole-Body Elimination of the Manganese-Based Magnetic Resonance Imaging Contrast Agent Mn-PyC3A.Invest Radiol. 2019 Nov;54(11):697-703. doi: 10.1097/RLI.0000000000000593. Invest Radiol. 2019. PMID: 31356382 Free PMC article.
-
A new biodegradable and biocompatible gadolinium (III) -polymer for liver magnetic resonance imaging contrast agent.Magn Reson Imaging. 2015 Jul;33(6):822-8. doi: 10.1016/j.mri.2015.03.002. Epub 2015 Mar 31. Magn Reson Imaging. 2015. PMID: 25839395
-
Development of a Gd(III)-based receptor-induced magnetization enhancement (RIME) contrast agent for β-glucuronidase activity profiling.Inorg Chem. 2012 Nov 19;51(22):12426-35. doi: 10.1021/ic301827p. Epub 2012 Nov 1. Inorg Chem. 2012. PMID: 23116118
-
Evaluation of a Gadolinium-Based Nanoparticle (AGuIX) for Contrast-Enhanced MRI of the Liver in a Rat Model of Hepatic Colorectal Cancer Metastases at 9.4 Tesla.Rofo. 2015 Dec;187(12):1108-15. doi: 10.1055/s-0035-1553500. Epub 2015 Sep 11. Rofo. 2015. PMID: 26361379
References
-
- Haradome H., Grazioli L., Tinti R., Morone M., Motosugi U., Sano K., et al. Additional value of gadoxetic acid‐DTPA‐enhanced hepatobiliary phase MR imaging in the diagnosis of early‐stage hepatocellular carcinoma: comparison with dynamic triple‐phase multidetector CT imaging. J Magn Reson Imaging. 2011; 34: 69–78. - PubMed
-
- Khan A.S., Hussain H.K., Johnson T.D., Weadock W.J., Pelletier S.J., Marrero J.A.. Value of delayed hypointensity and delayed enhancing rim in magnetic resonance imaging diagnosis of small hepatocellular carcinoma in the cirrhotic liver. J Magn Reson Imaging. 2010; 32: 360–366. - PubMed
-
- Park Y., Kim Y., Lee J.H., Lee E.Y., Kim H.S.. Usefulness of serum anti‐p53 antibody assay for lung cancer diagnosis. Arch Pathol Lab Med. 2011; 135: 1570–1575. - PubMed
-
- Misteli T., Spector D.L.. Applications of the green fluorescent protein in cell biology and biotechnology. Nat Biotechnol. 1997; 15: 961–964. - PubMed
Publication types
MeSH terms
Substances
LinkOut - more resources
Full Text Sources
Other Literature Sources
