. 2013 Aug;12(8):2136-47.
doi: 10.1074/mcp.M112.026138. Epub 2013 May 2.

Multi-omic data integration links deleted in breast cancer 1 (DBC1) degradation to chromatin remodeling in inflammatory response

Affiliations

Multi-omic data integration links deleted in breast cancer 1 (DBC1) degradation to chromatin remodeling in inflammatory response

Ernesto S Nakayasu et al. Mol Cell Proteomics. 2013 Aug.

Abstract

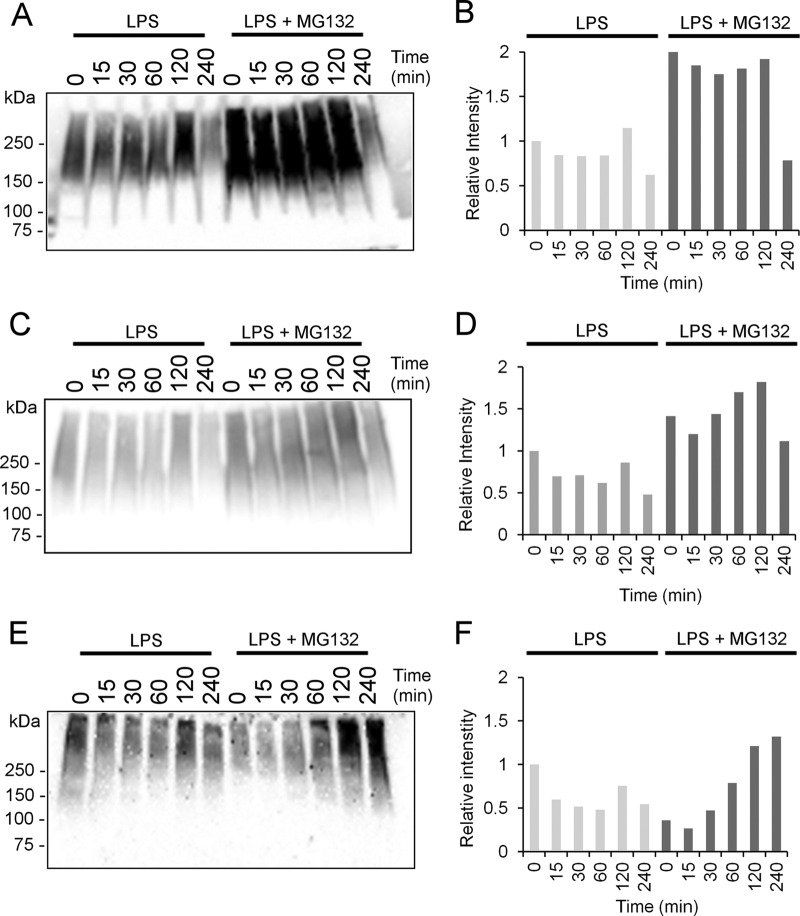
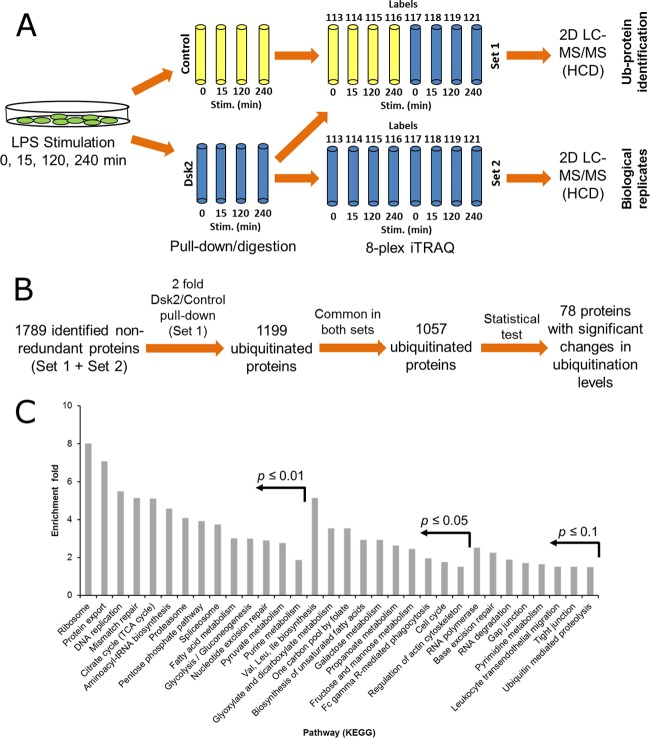
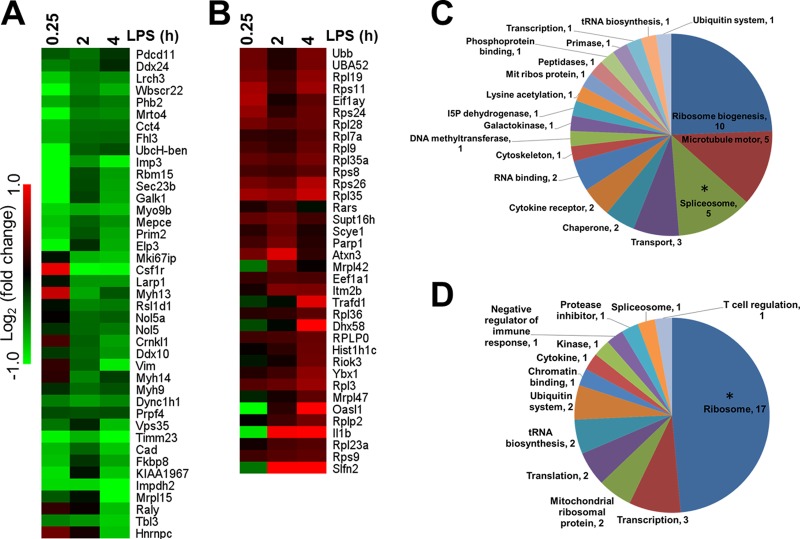
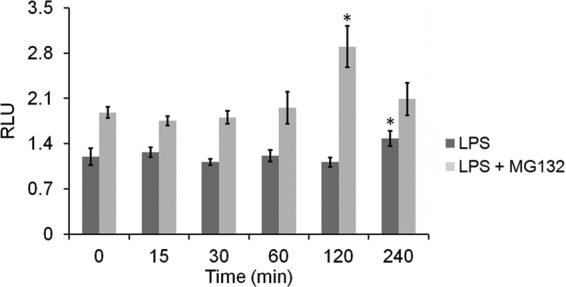
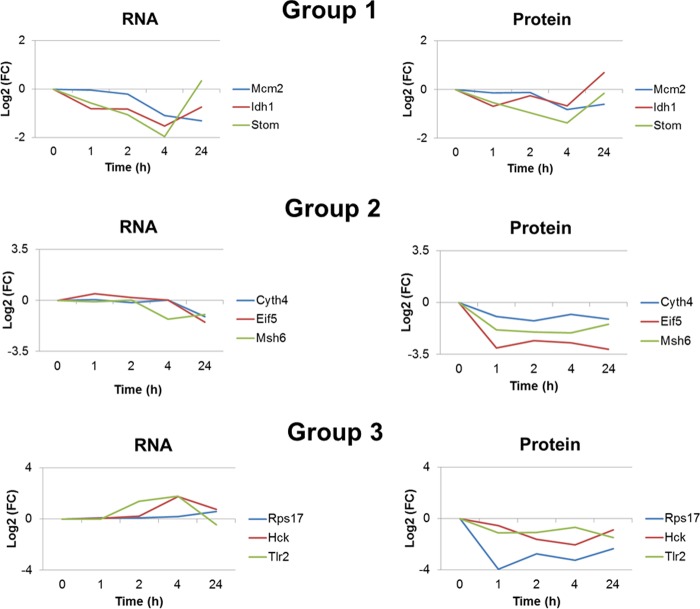
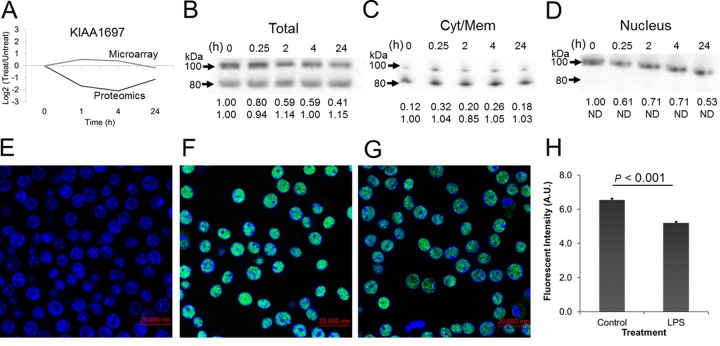
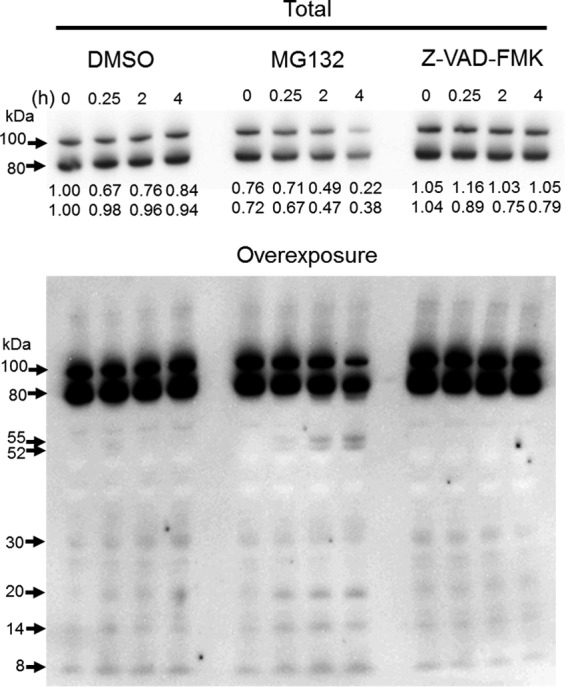
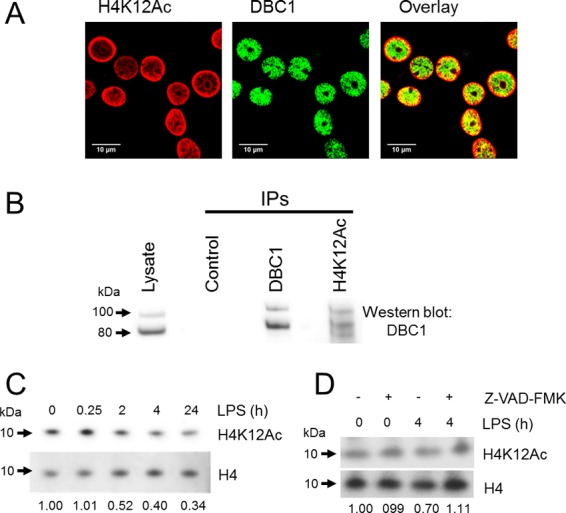
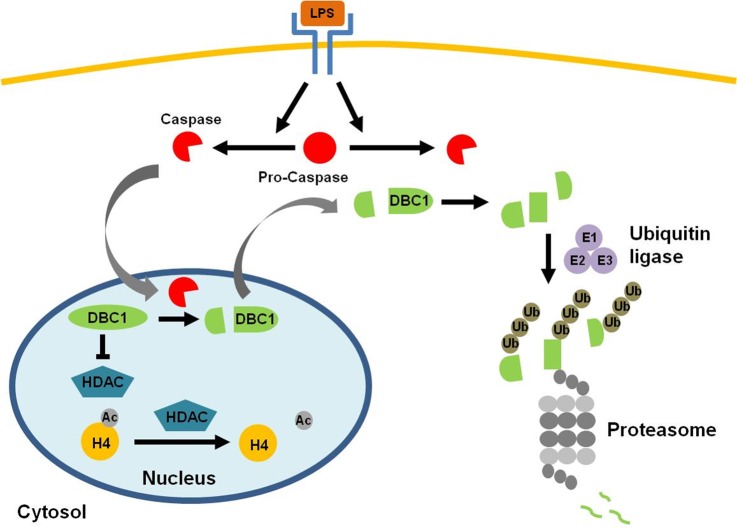
This study investigated the dynamics of ubiquitinated proteins after the inflammatory stimulation of RAW 264.7 macrophage-like cells with bacterial lipopolysaccharide. Ubiquitination is a common protein post-translational modification that regulates many key cellular functions. We demonstrated that levels of global ubiquitination and K48 and K63 polyubiquitin chains change after lipopolysaccharide stimulation. Quantitative proteomic analysis identified 1199 ubiquitinated proteins, 78 of which exhibited significant changes in ubiquitination levels following stimulation. Integrating the ubiquitinome data with global proteomic and transcriptomic results allowed us to identify a subset of 88 proteins that were targeted for degradation after lipopolysaccharide stimulation. Using cellular assays and Western blot analyses, we biochemically validated DBC1 (a histone deacetylase inhibitor) as a degradation substrate that is targeted via an orchestrated mechanism utilizing caspases and the proteasome. The degradation of DBC1 releases histone deacetylase activity, linking lipopolysaccharide activation to chromatin remodeling in caspase- and proteasome-mediated signaling.


Figures

Fig. 1.
Fig. 1.
Global ubiquitination levels in LPS-stimulated cells. RAW264.7 cells were pre-treated or not for 15 min with MG132 and then stimulated with LPS. The cells were harvested after 0 (unstimulated control), 15, 30, 60, 120, and 240 min and analyzed via Western blot against ubiquitin (A) and PolyUb at K48 (C) and K63 (E). The relative quantification, normalized by the loading with Ponceau S stain (supplemental Fig. S1), of the blots in panels A, C, and E are shown in B, D, and F, respectively. The Western blots are representatives of two independent experiments.
Fig. 2.
Fig. 2.
Quantitative proteomic analysis of ubiquitinated proteins from LPS-stimulated cells. A, RAW264.7 cells were stimulated with LPS for 0 (unstimulated), 15, 120, and 240 min, and the ubiquitinated proteins were captured with either control or Dsk2-conjugated agarose beads. Captured proteins were digested and labeled with two sets of 8-plex iTRAQ experiments, one for identifying the ubiquinated proteins, and the second for quantitative analysis. B, identification and quantification of ubiquitinated proteins. C, functional-enrichment analysis of total ubiquitinated proteins from RAW264.7 cells. All 1199 identified ubiquitinated proteins were submitted to a functional-enrichment analysis using Database for Annotation, Visualization and Integrated Discovery (DAVID) v6.7 (15).
Fig. 3.
Fig. 3.
RAW264.7 cells were stimulated with LPS for 0 (unstimulated control), 15, 120, and 240 min. Then ubiquitinated proteins were captured with agarose-conjugated Dsk2 UBA domain, digested with trypsin, and labeled with iTRAQ prior to proteomic analysis. A, B, heat maps show significantly (false discovery rate ≤ 0.05 as determined by Z-test) down- (A) and up-regulated (B) ubiquitinated proteins. C, D, functional annotation of down- (C) and up-regulated (D) ubiquitinated proteins. The annotation was performed with DAVID and manually curated using KEGG and Uniprot databases. The asterisks indicate the enriched functions (p < 0.05) by DAVID analysis.
Fig. 4.
Fig. 4.
Deubiquitinase activity in LPS-stimulated cells. RAW264.7 cells were pre-treated or not for 15 min with MG132 and then stimulated with LPS for 0 (unstimulated control), 15, 30, 60, 120, and 240 min. LPS stimulation was done in a regressive order for all cells having the same exposure time to MG132. DUB activity was measured based on luminescence using a DUB-Glo kit. The asterisks represent significant increases (p ≤ 0.05 as determined by t test) in the activity relative to the unstimulated control. RLU – relative luminescence unit.
Fig. 5.
Fig. 5.
Identification of degradation substrates induced by LPS stimulation. The graphs show the dynamics at transcription and protein levels of degradation substrate candidates. Group 1 represents proteins whose decrease is mainly driven by expression levels, whereas group 2 are classified as proteins that are diminished probably by both degradation and expression. Group 3 consists of proteins whose decrease was associated mainly with degradation. The full list of degradation substrate candidates is presented in supplemental Table S5.
Fig. 6.
Fig. 6.
Dynamics of DBC1 levels after LPS treatment. A, dynamics of DBC1 (KIAA1967 gene) RNA and protein levels measured by means of microarray and proteomics, respectively. B–D, RAW264.7 cells were treated with LPS for 0 (unstimulated), 0.25, 2, 4, and 24 h, and Western blots against DBC1 were performed in total cell lysates (B), cytosolic/membrane enriched fractions (Cyt/Mem) (C), or nuclear preparations (D). The normalized band intensity by Ponceau S stain (supplemental Fig. S3) of the total loading is shown under each Western blot. E–H, immunofluorescence of DBC1 in RAW 264.7 cells treated with LPS. DBC1 is labeled in green, and the DNA in blue. E, negative control for the secondary antibody. F, untreated cells. G, cells treated with LPS for 4 h. H, quantification of DBC1 immunofluorescence from the samples shown in F and G. These results are representatives of two independent experiments.
Fig. 7.
Fig. 7.
Effects of proteasome and caspase inhibition on DBC1 degradation. RAW264.7 cells were pre-treated or not for 15 min with MG132, Z-VAD-FMK, or DMSO vehicle control and then stimulated with 100 ng/ml for 0 (unstimulated control), 15, 30, 60, 120, and 240 min. LPS stimulation was done in a regressive order for all cells having the same exposure time to the drugs. Western blot was probed against DBC1. The normalized band intensity by Ponceau S stain (supplemental Fig. S4) of the total loading is shown under each Western blot. Overexposure of the same Western blot is shown at the bottom. The Western blots are representatives of two independent experiments. DMSO – dimethylsulfoxide.
Fig. 8.
Fig. 8.
Regulation of histone H4 acetylation in cells treated with LPS. A, immunofluorescence of DBC1 (green) and histone H4 acetylation at lysine 12 (H4K12Ac) (red) in RAW 264.7 cells. B, immunoprecipitation of proteins from RAW 264.7 cell lysate. Cell lysates were immunoprecipitated with no antibody (control) or anti-DBC1 (positive control) or anti-H4K12Ac antibodies and analyzed via Western blot using anti-DBC1 antibody. C, levels of histone H4 (loading control) and H4K12Ac in nuclear preparations of LPS-stimulated RAW264.7 cells. D, Levels of histone H4 (loading control) and histone H4 acetylation at lysine 12 (H4K12Ac) in nuclear preparations of LPS-stimulated RAW264.7 cells pretreated with Z-VAD-FMK or DMSO vehicle control. The Western blots are representatives of two independent experiments.
Fig. 9.
Fig. 9.
Proposed model of chromatin changes mediated by DBC1. Upon LPS-stimulation, caspases are activated and process DBC1, which is translocated from the nucleus to the cytosol, releasing HDAC activity. The cytosolic form of DBC1 is further processed by caspases before being ubiquitinated and targeted to proteasome degradation.

Similar articles

Cited by

References

    1. Behrends C., Harper J. W. (2011) Constructing and decoding unconventional ubiquitin chains. Nat. Struct. Mol. Biol. 18, 520–528 - PubMed
    1. Reyes-Turcu F. E., Ventii K. H., Wilkinson K. D. (2009) Regulation and cellular roles of ubiquitin-specific deubiquitinating enzymes. Annu. Rev. Biochem. 78, 363–397 - PMC - PubMed
    1. Jiang X., Chen Z. J. (2011) The role of ubiquitylation in immune defence and pathogen evasion. Nat. Rev. Immunol. 12, 35–48 - PMC - PubMed
    1. Kawai T., Akira S. (2010) The role of pattern-recognition receptors in innate immunity: update on Toll-like receptors. Nat. Immunol. 11, 373–384 - PubMed
    1. Hicks S. W., Galan J. E. (2010) Hijacking the host ubiquitin pathway: structural strategies of bacterial E3 ubiquitin ligases. Curr. Opin. Microbiol. 13, 41–46 - PMC - PubMed

Publication types

LinkOut - more resources