. 2013 Jun 7;58(11):3551-62.
doi: 10.1088/0031-9155/58/11/3551. Epub 2013 May 2.

Photo-magnetic imaging: resolving optical contrast at MRI resolution

Affiliations

Photo-magnetic imaging: resolving optical contrast at MRI resolution

Yuting Lin et al. Phys Med Biol. .

Abstract

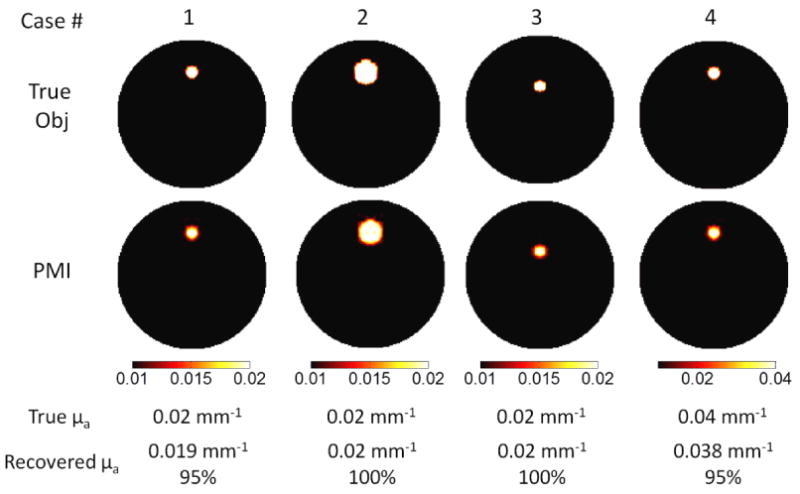
In this paper, we establish the mathematical framework of a novel imaging technique, namely photo-magnetic imaging (PMI). PMI uses a laser to illuminate biological tissues and measure the induced temperature variations using magnetic resonance imaging (MRI). PMI overcomes the limitation of conventional optical imaging and allows imaging of the optical contrast at MRI spatial resolution. The image reconstruction for PMI, using a finite-element-based algorithm with an iterative approach, is presented in this paper. The quantitative accuracy of PMI is investigated for various inclusion sizes, depths and absorption values. Then, a comparison between conventional diffuse optical tomography (DOT) and PMI is carried out to illustrate the superior performance of PMI. An example is presented showing that two 2 mm diameter inclusions embedded 4.5 mm deep and located side by side in a 25 mm diameter circular geometry medium are recovered as a single 6 mm diameter object with DOT. However, these two objects are not only effectively resolved with PMI, but their true concentrations are also recovered successfully.


Figures

Figure 1
Figure 1
The laser irradiation pattern for PMI and DOT and the FEM mesh used for simulations (coarse mesh for reconstruction). (a) In PMI, an area illumination pattern was used to irradiate the phantom. MR thermometry map is acquired across the entire imaging area, and each nodal point on the mesh is selected as the detector position for temperature measurement. (b) 8-source and 8-detector positions equally spaced over 360 degrees were used for DOT.
Figure 2
Figure 2
The temperature profile at the center of the inclusion plotted at different time points. P1 and P2 are acquired at the heating duration, while P3, P4 and P5 are acquired at the cooling period.
Figure 3
Figure 3
The result for simulation study section 3.1. The left column is the temperature increase at the selected temperature measurement point. The right column is the reconstructed absorption map for the six cases. The recovered mean absorption coefficient for the inclusion is listed beside the reconstructed images. The percentage indicates that the heat diffusion can diminish the quantitative accuracy if the measurements are acquired during the laser-off phase.
Figure 4
Figure 4
The results for simulation study section 3.2. The first row is true size, depth and concentration of the inclusion. The reconstructed absorption maps for each case are shown in the second row. The color map is scaled from 0.01 mm-1 to 0.02 mm-1 for cases 1-3, from 0.01 mm-1 to 0.04mm-1 for case 4. The unit for all the color bars is mm-1. As seen in the images, the recovered absorption coefficient does not depend on the size, depth and concentration of the inclusion. The recovered absorption coefficient is listed below the reconstructed images. The percentage indicates that the size and depth dependence for quantitative accuracy is alleviated in PMI technique.
Figure 5
Figure 5
The results for simulation study section 3.3. The true size, depth and concentration of the inclusions are shown in (a). The reconstructed absorption maps from DOT and PMI is shown in (b) and (c), respectively. As seen in the images, the two inclusions cannot be resolved in DOT reconstruction images due to the spatial resolution limitation, while they can be well separated in PMI images.

Similar articles

Cited by

References

    1. Akers WJ, Edwards WB, Kim C, Xu B, Erpelding TN, Wang LV, Achilefu S. Multimodal sentinel lymph node mapping with single-photon emission computed tomography (SPECT)/computed tomography (CT) and photoacoustic tomography. Translational Research. 2012;159:175–81. - PMC - PubMed
    1. Arridge SR. Optical tomography in medical imaging. Inverse Problems. 1999a;15:R41.
    1. Arridge SR. Optical tomography in medical imaging. Inverse Problems. 1999b;15:R41–R93.
    1. Blyschak K, Simick M, Jong R, Lilge L. Classification of breast tissue density by optical transillumination spectroscopy: optical and physiological effects governing predictive value. Med Phys. 2004;31:1398–414. - PubMed
    1. Brooksby B, Pogue BW, Jiang S, Dehghani H, Srinivasan S, Kogel C, Tosteson TD, Weaver J, Poplack SP, Paulsen KD. Imaging breast adipose and fibroglandular tissue molecular signatures by using hybrid MRI-guided near-infrared spectral tomography. Proceedings of the National Academy of Sciences of the United States of America. 2006;103:8828–33. - PMC - PubMed

Publication types