. 2013 Jul;33(7):1601-11.
doi: 10.1161/ATVBAHA.113.300972. Epub 2013 May 2.

4-Hydroxy-2-nonenal enhances tissue factor activity in human monocytic cells via p38 mitogen-activated protein kinase activation-dependent phosphatidylserine exposure

Affiliations

4-Hydroxy-2-nonenal enhances tissue factor activity in human monocytic cells via p38 mitogen-activated protein kinase activation-dependent phosphatidylserine exposure

Rit Vatsyayan et al. Arterioscler Thromb Vasc Biol. 2013 Jul.

Abstract

Objective: 4-hydroxy-2-nonenal (HNE) is one of the major aldehydes formed during lipid peroxidation and is believed to play a role in the pathogenesis of atherosclerosis. The objective of the present study is to investigate the effect of HNE on tissue factor (TF) procoagulant activity expressed on cell surfaces.

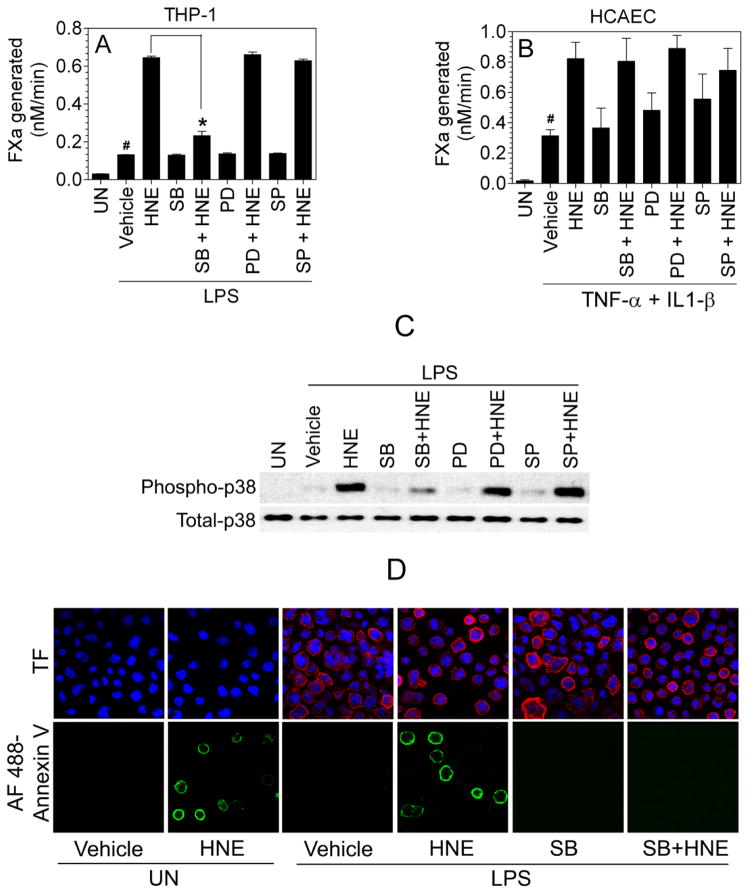
Approach and results: TF activity and antigen levels on intact cells were measured using factor Xa generation and TF monoclonal antibody binding assays, respectively. Exposure of phosphatidylserine on the cell surface was analyzed using thrombin generation assay or by binding of a fluorescent dye-conjugated annexin V. 2',7'-dichlorodihydrofluorescein diacetate was used to detect the generation of reactive oxygen species. Our data showed that HNE increased the procoagulant activity of unperturbed THP-1 cells that express traces of TF antigen, but had no effect on unperturbed endothelial cells that express no measurable TF antigen. HNE increased TF procoagulant activity but not TF antigen of both activated monocytic and endothelial cells. HNE treatment generated reactive oxygen species, activated p38 mitogen-activated protein kinase, and increased the exposure of phosphatidylserine at the outer leaflet in THP-1 cells. Treatment of THP-1 cells with an antioxidant, N-acetyl cysteine, suppressed the above HNE-induced responses and negated the HNE-mediated increase in TF activity. Blockade of p38 mitogen-activated protein kinase activation inhibited HNE-induced phosphatidylserine exposure and increased TF activity.

Conclusions: HNE increases TF coagulant activity in monocytic cells through a novel mechanism involving p38 mitogen-activated protein kinase activation that leads to enhanced phosphatidylserine exposure at the cell surface.

Keywords: 4-hydroxy-2-nonenal; atherosclerosis; microparticles; oxidative stress; p38 mitogen-activated protein kinase; tissue factor.


Figures

Figure 1
Figure 1
HNE-mediated increase in TF procoagulant activity in THP-1 cells and HCAEC, and its comparison with other reactive aldehydes. THP-1 cells or HCAEC were treated with HNE and other compounds as described below, and at the end of treatment, cell surface TF activity was determined in FX activation assay. (A) Unperturbed THP-1 cells were treated with varying concentrations of HNE for 4 h. (B) THP-1 cells were stimulated with 1 μg/ml LPS for 4 h in RPMI medium containing 2% serum, and then treated with varying concentrations of HNE for 4 h. (C) LPS-stimulated THP-1 cells were treated with 20 μM HNE for varying time periods. (D and E) HCAEC monolayers cultured in 48-well plate were perturbed with 20 ng/ml of each TNF-α and IL1-β for 4 h in 2% serum containing EBM-2 medium, and then treated with varying concentrations of HNE for 4 h (D) or with 40 μM HNE for varying time periods (E). (F and G) LPS-stimulated THP-1 cells (F) or cytokine-activated HCAEC (G) were treated with HNE and other reactive aldehydes for 4 h (20 μM concentration for THP-1 cells and 40 μM concentration for HCAEC). UN, unperturbed cells. In panel A, * denotes that the value is statistically significantly higher compared to cells not treated with HNE (p <0.05). In other panels, # denotes statistically significantly different from unperturbed cells (p <0.01); * denotes statistically significant difference compared to LPS- or TNF-α/IL1-β-stiumlated cells that were not subjected to HNE or other treatments (p <0.01).
Figure 2
Figure 2
HNE increases TF activity in monocytic cells without increasing TF protein levels but increasing phosphatidylserine at the cell surface. (A) LPS-stimulated THP-1 cells were treated with HNE (20 μM) for 4 h in RPMI medium containing 2% serum. At the end of the treatment period, cells were washed, chilled on ice for 10 min, and then 125I-TF mAb 9C3 (10 nM) was added to the cells. After 2 h incubation at 4°C, 125I-TF mAb bound to the cells was determined. ns, not statistically significant difference. (B) THP-1 cells were treated same as in panel A except that cells were lysed at the end of HNE treatment in TBS containing 2% Triton X-100 and 5 mM EDTA and total cell TF antigen levels were determined in TF-specific ELISA. (C) LPS-stimulated THP-1 cells were treated with HNE as described in (A). At the end of HNE treatment, cells were incubated with ± 200 nM annexin V for 30 min at 37°C and then cell surface TF activity was measured. * denotes statistically significant inhibition in the presence of annexin V (p < 0.01). (D) LPS-stimulated THP-1 cells were treated with HNE as described in (A), and prothrombinase activity was measured by incubating cells with buffer B containing FVa (10 nM) and FXa (1 nM), and subsequent addition of prothrombin (5 μM). (E) NBD-PS uptake. Unperturbed and LPS-stimulated THP-1 cells were treated with a control vehicle or HNE (20 μM for 1 h) and then loaded with NBD-PS at 4°C. After removing the free NBD-PS, cells were incubated for 10 min at 37°C and then fluorescence intensity was measured in the presence or absence of cell impermeant quencher dithionite. The percent NBD-PS internalized was calculated as described in methods. * denotes statistically significant difference compared to cells not treated with HNE (p <0.05). UN, unperturbed cells.
Figure 3
Figure 3
HNE-induced ROS generation and its effect on HNE-mediated increase in TF activity. Unperturbed or LPS-stimulated THP-1 cells (A), unperturbed or TNF-α/IL1-β-stimulated HCAEC (B) were loaded with H2DCFDA (for THP-1 cells, 5 μM for 10 min; HCAEC, 10 μM for 30 min) in serum-free medium. After removing the supernatant, cells were washed once with serum-free medium and treated with HNE (20 μM for THP-1 cells; 40 μM for HCAEC) for 45 min. At the end of HNE treatment, cells were washed twice with HBS and fluorescence images were obtained by confocal microscopy, and the fluorescence intensity associated with the cells was quantified. Where cells were treated with rotenone (2 μM), it was added to the cells after 3 h of LPS or cytokine stimulation. (C) LPS-stimulated THP-1 cells or (D) TNF-α/IL1-β-stimulated HCAEC were incubated with various ROS inhibitors - rotenone (Rot, 2 μM), allopurinol (Al, 100 μM), or apocynin (AP, 30 μM) for 1 h followed by a 4 h treatment with 20 or 40 μM HNE, respectively. At the end of treatment, TF activity was determined in FX activation assay. UN, unperturbed cells; # denotes statistically significant difference compared to unperturbed cells (p <0.01); * denotes statistically significant difference compared to HNE-treated cells in the absence of inhibitors (p < 0.01).
Figure 4
Figure 4
Inhibition of p38 MAPK pathway blocks HNE-mediated increased TF activity in THP-1 cells. LPS-stimulated THP-1 cells (A) or TNF-α/IL1-β-stimulated HCAEC (B) were incubated with various MAPK inhibitors (20 μM) - SB203580 (SB), SP600125 (SP), and PD98059 (PD) - for 1 h followed by a 4 h treatment with 20 or 40 μM HNE, respectively. At the end of the treatment, TF activity was determined in FX activation assay. (C) LPS-stimulated THP-1 cells were treated with inhibitors, same as in panel A, and at the end of the treatment, cells were lysed and subjected to a non-reducing SDS-PAGE and immunoblotted with phospho p38 MAPK and total p38 MAPK antibodies. (D) LPS-stimulated THP-1 cells treated with inhibitors and HNE as described in panel A were stained for cell surface PS using AF488-annexin V and immunostained with TF mAb. DAPI was used for nucleus staining. The fluorescence images were obtained by confocal microscopy. UN, unperturbed cells; # denotes statistical significant difference compared to unperturbed cells (p <0.01); * denotes statistically significant difference compared to HNE-treated cells in the absence of inhibitors (p < 0.01).
Figure 5
Figure 5
Thiol protecting agents attenuate HNE-induced ROS generation and increased TF activity. THP-1 cells (A) or HCAEC (B), stimulated with LPS or cytokines, respectively, were treated with NAC (3 mM) for 1 h and then loaded with H2DCFDA (experimental conditions were essentially same as in Fig. 3). Thereafter, the cells were treated with 20 or 40 μM HNE, respectively, for 45 min, and then analyzed for ROS generation. (C) LPS-stimulated THP-1 cells were treated with NAC (3 mM) or MPG (100 μM) for 1 h, followed by addition of HNE (20 μM). At the end of 4 h HNE treatment, the cells were lysed and subjected to a non-reducing SDS-PAGE and immunoblotted with phospho p38 MAPK or total p38 MAPK antibodies. (D and E). LPS-stimulated THP-1 cells or cytokine-stimulated HCAEC were treated with NAC (3 mM) or MPG (100 μM) for 1 h followed by HNE (20 μM for THP-1 cells and 40 μM for HCAEC) for 4 h. At the end of HNE treatment, TF activity was determined in FX activation assay. (F) LPS-stimulated THP-1 cells treated with NAC followed by HNE (as described in panel D) were stained for cell surface PS using AF488-annexin V, and immunostained with TF mAb. DAPI was used for nucleus staining. (G) LPS-stimulated THP-1 cells were treated with a control vehicle or rotenone (2 μM for 1 h) followed by HNE for 4 h. The cells were stained with AF488-annexin V and immunostained with TF mAb (9C3). UN, unperturbed cells; # denotes statistically significant difference compared to unperturbed cells (p <0.01); * denotes statistically significant difference compared to cells treated with HNE in the absence of thiol protectants (p < 0.01).
Figure 6
Figure 6
HNE treatment releases TF bearing microparticles. TNF-α + IL1-β-stimulated HCAEC (A) or WI-38 fibroblasts (B) were treated with 40 μM HNE for varying time periods. At the end of the treatment, overlying medium was collected, centrifuged at 1,000 × g for 5 min to remove cell debris followed by centrifugation at 20,000 × g for 1 h to isolate MP. TF activity associated with MP was measured in FX activation assay. UN, unperturbed cells; * denotes statistically significant difference compared to cells not treated with HNE (p < 0.01).

Similar articles

Cited by

References

    1. Uchida K. Role of reactive aldehyde in cardiovascular diseases. Free Radic Biol Med. 2000;28:1685–1696. - PubMed
    1. Yin H, Xu L, Porter NA. Free radical lipid peroxidation: mechanisms and analysis. Chem Rev. 2011;111:5944–5972. - PubMed
    1. Strohmaier H, Hinghofer-Szalkay H, Schaur RJ. Detection of 4-hydroxynonenal (HNE) as a physiological component in human plasma. J Lipid Mediat Cell Signal. 1995;11:51–61. - PubMed
    1. Esterbauer H, Gebicki J, Puhl H, Jurgens G. The role of lipid peroxidation and antioxidants in oxidative modification of LDL. Free Radic Biol Med. 1992;13:341–390. - PubMed
    1. Usatyuk PV, Parinandi NL, Natarajan V. Redox regulation of 4-hydroxy-2-nonenal-mediated endothelial barrier dysfunction by focal adhesion, adherens, and tight junction proteins. J Biol Chem. 2006;281:35554–35566. - PubMed

Publication types

MeSH terms