

Genomic BLUP decoded: a look into the black box of genomic prediction
- PMID: 23640517
- PMCID: PMC3697966
- DOI: 10.1534/genetics.113.152207
Genomic BLUP decoded: a look into the black box of genomic prediction
Abstract
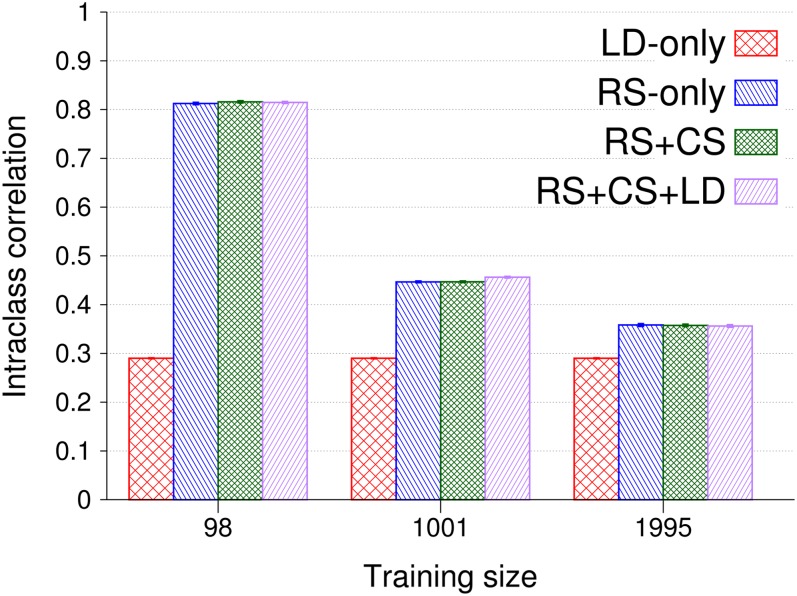
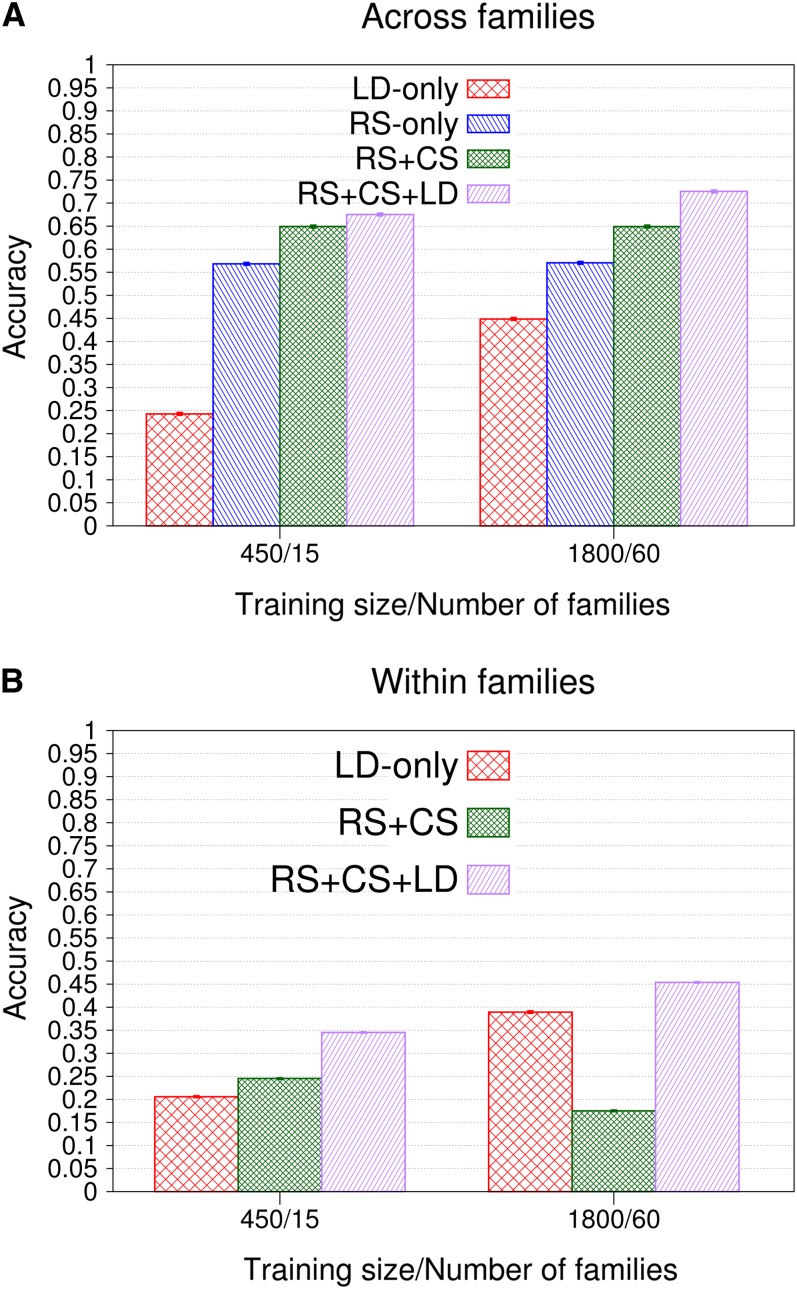
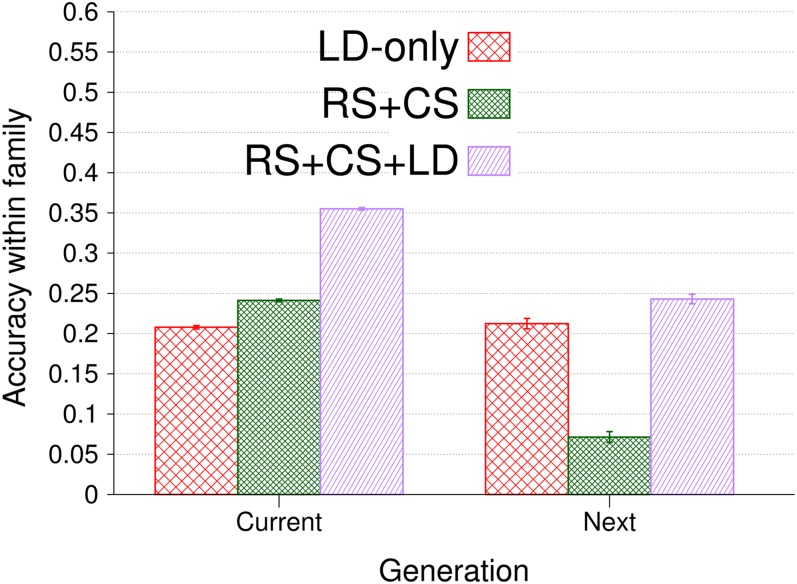
Genomic best linear unbiased prediction (BLUP) is a statistical method that uses relationships between individuals calculated from single-nucleotide polymorphisms (SNPs) to capture relationships at quantitative trait loci (QTL). We show that genomic BLUP exploits not only linkage disequilibrium (LD) and additive-genetic relationships, but also cosegregation to capture relationships at QTL. Simulations were used to study the contributions of those types of information to accuracy of genomic estimated breeding values (GEBVs), their persistence over generations without retraining, and their effect on the correlation of GEBVs within families. We show that accuracy of GEBVs based on additive-genetic relationships can decline with increasing training data size and speculate that modeling polygenic effects via pedigree relationships jointly with genomic breeding values using Bayesian methods may prevent that decline. Cosegregation information from half sibs contributes little to accuracy of GEBVs in current dairy cattle breeding schemes but from full sibs it contributes considerably to accuracy within family in corn breeding. Cosegregation information also declines with increasing training data size, and its persistence over generations is lower than that of LD, suggesting the need to model LD and cosegregation explicitly. The correlation between GEBVs within families depends largely on additive-genetic relationship information, which is determined by the effective number of SNPs and training data size. As genomic BLUP cannot capture short-range LD information well, we recommend Bayesian methods with t-distributed priors.
Keywords: GenPred; Shared data resources; additive-genetic relationships; cosegregation; genomic best linear unbiased prediction (BLUP); genomic selection; linkage disequilibrium (LD).
Figures
Similar articles
-
The impact of genetic relationship information on genomic breeding values in German Holstein cattle.Genet Sel Evol. 2010 Feb 19;42(1):5. doi: 10.1186/1297-9686-42-5. Genet Sel Evol. 2010. PMID: 20170500 Free PMC article.
-
Accuracy of Genomic Prediction in Synthetic Populations Depending on the Number of Parents, Relatedness, and Ancestral Linkage Disequilibrium.Genetics. 2017 Jan;205(1):441-454. doi: 10.1534/genetics.116.193243. Epub 2016 Nov 9. Genetics. 2017. PMID: 28049710 Free PMC article.
-
The impact of genetic relationship information on genome-assisted breeding values.Genetics. 2007 Dec;177(4):2389-97. doi: 10.1534/genetics.107.081190. Genetics. 2007. PMID: 18073436 Free PMC article.
-
Contributions of linkage disequilibrium and co-segregation information to the accuracy of genomic prediction.Genet Sel Evol. 2016 Oct 11;48(1):77. doi: 10.1186/s12711-016-0255-4. Genet Sel Evol. 2016. PMID: 27729012 Free PMC article.
-
Complex Trait Prediction from Genome Data: Contrasting EBV in Livestock to PRS in Humans: Genomic Prediction.Genetics. 2019 Apr;211(4):1131-1141. doi: 10.1534/genetics.119.301859. Genetics. 2019. PMID: 30967442 Free PMC article. Review.
Cited by
-
Genomic evaluation for breeding and genetic management in Cordia africana, a multipurpose tropical tree species.BMC Genomics. 2024 Jan 2;25(1):9. doi: 10.1186/s12864-023-09907-z. BMC Genomics. 2024. PMID: 38166623 Free PMC article.
-
Genomic Prediction of Complex Traits, Principles, Overview of Factors Affecting the Reliability of Genomic Prediction, and Algebra of the Reliability.Methods Mol Biol. 2022;2467:45-76. doi: 10.1007/978-1-0716-2205-6_2. Methods Mol Biol. 2022. PMID: 35451772
-
Genomic Prediction Within and Among Doubled-Haploid Libraries from Maize Landraces.Genetics. 2018 Dec;210(4):1185-1196. doi: 10.1534/genetics.118.301286. Epub 2018 Sep 26. Genetics. 2018. PMID: 30257934 Free PMC article.
-
Training population selection and use of fixed effects to optimize genomic predictions in a historical USA winter wheat panel.Theor Appl Genet. 2019 Apr;132(4):1247-1261. doi: 10.1007/s00122-019-03276-6. Epub 2019 Jan 24. Theor Appl Genet. 2019. PMID: 30680419 Free PMC article.
-
A survey of functional genomic variation in domesticated chickens.Genet Sel Evol. 2018 Apr 16;50(1):17. doi: 10.1186/s12711-018-0390-1. Genet Sel Evol. 2018. PMID: 29661130 Free PMC article.
References
-
- Albrecht T., Wimmer V., Auinger H.-J., Erbe M., Knaak C., et al. , 2011. Genome-based prediction of testcross values in maize. Theor. Appl. Genet. 123: 339–350 - PubMed
-
- Bernardo R., 2010. Breeding for Quantitative Traits in Plants, Ed. 2 Stemma Press, Woodbury, Minnesota
-
- Calus M., Veerkamp R., 2007. Accuracy of breeding values when using and ignoring the polygenic effect in genomic breeding value estimation with a marker density of one SNP per cM. J. Anim. Breed. Genet. 124: 362–368 - PubMed
Publication types
MeSH terms
Grants and funding
LinkOut - more resources
Full Text Sources
Other Literature Sources
Research Materials
